
Observation is defined in the Oxford English dictionary as "the action or process of observing something or someone carefully or in order to gain information." In software, Observability is the act of observing the inner state of a system to gain information about its health, performance, and behavior. It's more than just logging, it's about understanding the system's behavior and performance in real-time.
But we already do logging, isn't that enough?
Probably - for most websites, logging is going to cover most of your needs. looking through logs to find errors and exceptions will give you a good idea of what's going on in your system, let you track down the stack trace of an exception, and help you understand what's going on in your system. You can even aggregate logs from multiple sources and search through them to find patterns and trends, with a little bit of work.
The problem is logging can quickly get very verbose, but at the same time not contain enough information. Depending on the level of logging you have, and the number of requests you're dealing with, you may have to look through a large number of logs, extract an exception with a stack trace, potentially cross reference multiple logs and then try to figure out what went wrong. This can be time-consuming and frustrating, especially if you're trying to track down a bug in a production system.
How is Observability Different?
Observability is about more than just logging - it's about understanding the behavior of your system in real-time, and make use of two new signals - metrics and traces. By adding metrics and traces on top of logging, you get a much better picture of what's going on in your system - how many requests are being processed, how long they're taking, and where they're going. Together with logging, metrics and traces make up the three signals of observability.
Metrics and Traces?
Where logging is concerned with the state of one part of the system at a point in time, metrics are concerned with the state of the system over time. This could be the number of requests being processed, the amount of memory being used, or the number of exceptions being thrown.
Traces are concerned with the flow of a request through the system. By adding a unique identifier to a request, you can track it through the system, and see how long it takes to process, where it goes, and what happens to it. This can help you understand the performance of your system, track down bottlenecks, and even predict when something is going to go wrong.
Open Telemetry
Open Telemetry (OTel) is the protocol we will use collecting and sending telemetry data in a central location where we can interrogate it. It's open source (the OPEN in Open Telemetry) and is designed to be Vendor neutral, supporting a host of languages which can be found on the Open Telemetry website - crucially for us including .NET.
What OTel does is gather signals from all parts of your distributed applications into a single collector, which can then be used with third party observability backends - like Jaeger, Prometheus etc. The Telemetry part of the name comes from the Greek word "tele" meaning "remote" and "metron" meaning "measure" - accepting those signals into a single collector for analysis.
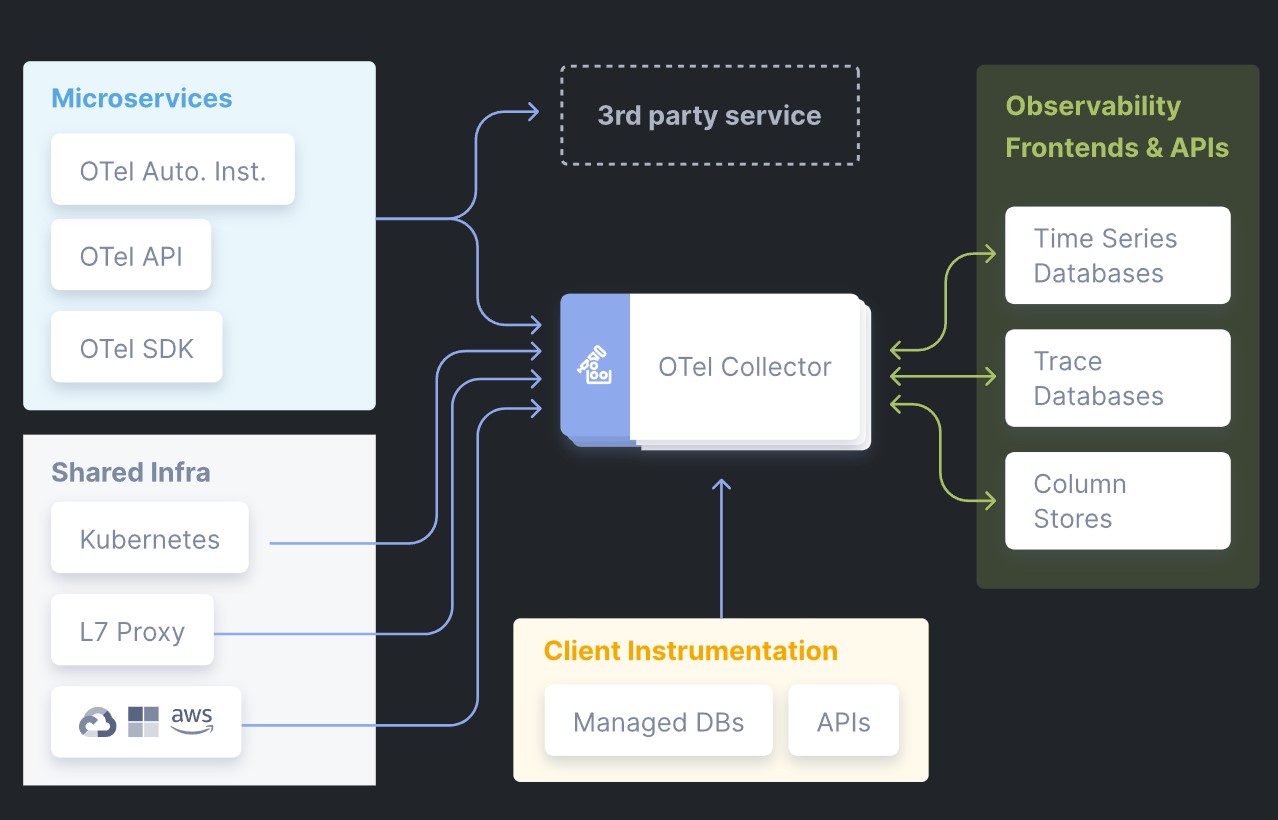
Communication between the application and the central location is done using the Open Telemetry Protocol (OTLP) which sends signals to a central listener, where they can be stored and analyzed.
The .NET Aspire dashboard which processes these signals to has a built-in OTLP server to demonstrate the concepts. However the Aspire Standalong dashboard is a development tool and doesn't support telemetry persistence. If you want to persist your telemetry data, you'll need to set up a third party service to do so.
So how does this all work?
I find that showing, not telling is sometimes the best wayk, but there are a few pre-requisites to getting this working.
Docker
This examples uses Docker to run the .NET Aspire Dashboard in standalone mode. You can download Docker Desktop from here.
Aspire Dashboard
The .NET Aspire Dashboard is a standalone dashboard that can be used to monitor your .NET applications. It's built on top of Open Telemetry, and can be run in a container, allowing us to view logs, metrics, and traces from our application in real-time. Please note - this article isn't about running Umbraco in .NET Aspire, or in a container - we are just using a part of the Aspire tooling, the dashboard, to monitor our Umbraco application.
If you would like to learn more about running Umbraco in .NET Aspire, you can find more information at Dennis Adolfi's excellent blogs here or my own article and sample site here.
Sample Project
The code for this project is available on GitHub here. To get started, clone the repository and open the solution in Visual Studio, or your preferred IDE.
Before you run the project, you need to start the .NET Aspire Dashboard. You can do this by running the following command in the root of the repository:
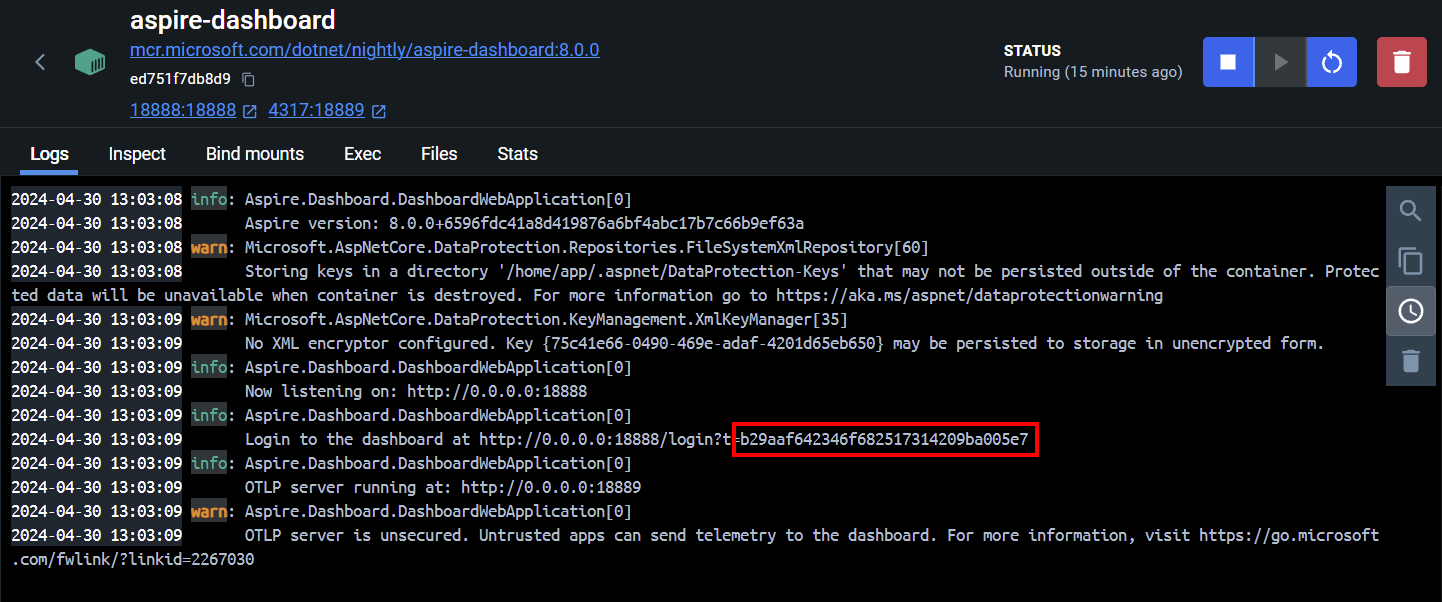
docker run --rm -it -d -p 18888:18888 -p 4317:18889 -e DOTNET_DASHBOARD_UNSECURED_ALLOW_ANONYMOUS=’true’ --name aspire-dashboard mcr.microsoft.com/dotnet/aspire-dashboard:latestThis will start the Aspire Dashboard in a container, and you can access it by navigating to http://localhost:18888 in your browser. When the dashboard is running, you will need to examine the logs to get the URL with access token to log in to the dashboard. This should be visible in the terminal window where you ran the docker run command, or you can click on the container in Docker Desktop and view the logs there.
For more information on configuring the Aspire Dashboard, see the official documentation.
Once the dashboard is running, you can configure the Umbraco project to send telemetry data to the dashboard.
Configure OpenTelemetry
The following steps have already been configured in the sample project, but I'll include them here for reference. In order to set-up OpenTelemetry, you need to install the OpenTelemetry nuget packages into the UmbObservability project. You can do this by running the following commands:
dotnet add UmbObservability package OpenTelemetry.Exporter.OpenTelemetryProtocol
dotnet add UmbObservability package OpenTelemetry.Extensions.Hosting
dotnet add UmbObservability package OpenTelemetry.Instrumentation.AspNetCore
dotnet add UmbObservability package OpenTelemetry.Instrumentation.Http
dotnet add UmbObservability package OpenTelemetry.Instrumentation.Runtime
You also need to add the following to your appsettings.json file at the root level. This represents the GRPC port that the Aspire Dashboard is listening on, which you can see from Docker Desktop. We also have a friendly name for our service, which will be displayed in the Aspire Dashboard along with our Logs, Metrics and Traces.
{
    "OTEL_EXPORTER_OTLP_ENDPOINT": "http://localhost:4317",
    "OTEL_SERVICE_NAME": "UmbObservability"
}
Finally you need to modify the program.cs with the following to configure the export of signals to the .NET Aspire dashboard listener.
// Configure Logging
var openTelemetryUri = new Uri(builder.Configuration["OTEL_EXPORTER_OTLP_ENDPOINT"]);
var serviceName = builder.Configuration["OTEL_SERVICE_NAME"];

builder.Services.AddOpenTelemetry()
    .ConfigureResource(res => res
        .AddService(serviceName))
    .WithMetrics(metrics =>
    {
        // Configure metrics with the build in AspNetCore and HttpClient instrumentation
        metrics
            .AddHttpClientInstrumentation()
            .AddAspNetCoreInstrumentation()
            .AddRuntimeInstrumentation();
        // Also add a custom metric to track the number of page views
        metrics.AddMeter(DiagnosticsConfig.Meter.Name);
        metrics.AddOtlpExporter(opt => opt.Endpoint = openTelemetryUri);
    }).WithTracing(tracing =>
        {
            // Configure tracing with the build in AspNetCore and HttpClient instrumentation
            tracing
                .AddAspNetCoreInstrumentation()
                .AddHttpClientInstrumentation();
            tracing.AddOtlpExporter(opt => opt.Endpoint = openTelemetryUri);

        }
    );

// Configure Logging to send signals to the Aspire Dashboard
builder.Logging.AddOpenTelemetry(log =>
{
    log.AddOtlpExporter(opt => opt.Endpoint = openTelemetryUri);
    log.IncludeScopes = true;
    log.IncludeFormattedMessage = true;
});
With the OpenTelemetry packages installed, and the configuration set-up, you can now run the project. When you navigate to the Aspire Dashboard, you should see the signals from the UmbObservability project being sent to the dashboard.
dotnet run --project UmbObservabilityIf you navigate around the site now, you should be able to see logs appearing in the Aspire Dashboard.
Metrics
Metrics are a way of measuring the state of the system over time. There are different types of metrics, but the most common are counters, gauges, and histograms. Counters are used to measure the number of times an event occurs, gauges are used to measure the value of a variable, and histograms are used to measure the distribution of values over time.
The benefit of using .NET is that there are already a log of metrics gathered for you, the full list is in the Metrics tab, and will include such metrics as Exception Count, Request Counts, Request durations, open connections - and many more.
In this example, I've implemented a custom metric called Page.count which increments every time you navigate to any URL in the site. This is done by adding a middleware to the application, which increments the counter every time a request is processed. The counter is then sent to the Aspire Dashboard, where you can see it in real-time.
The metric is defined as follows :
public static class DiagnosticsConfig
{
    //Resource name for Aspire Dashboard
    public const string ServiceName = "UmbObservability.Counts";

    public static Meter Meter = new(ServiceName);

    //Metric to track the number of page visits
    public static Counter<int> PageCounter = Meter.CreateCounter<int>("page.count");

}
The static PageCounter keeps a track of all pageViews, and is incremented in the middleware as follows:
public class MyPageCountMiddleware
{
    private readonly RequestDelegate _next;
    private readonly ILogger<MyPageCountMiddleware> _logger;

    public MyPageCountMiddleware(RequestDelegate next, ILogger<MyPageCountMiddleware> logger)
    {
        _next = next;
        _logger = logger;
    }

    public async Task InvokeAsync(HttpContext context)
    {
        // Check if the request is for static assets (CSS/JS/images)
        if (context.Request.Method == HttpMethods.Get && !IsStaticAsset(context.Request.Path))
        {
            _logger.LogInformation($"Request for {context.Request.Path} received");
            var urlName = context.Request.Path.Value.ToLowerInvariant();
            DiagnosticsConfig.PageCounter.Add(1, new KeyValuePair<string, object>("page.url", urlName));
        }

        // Call the next middleware in the pipeline
        await _next(context);
    }

    private bool IsStaticAsset(string path)
    {
        // Regex pattern to match typical static asset extensions
        var staticAssetPattern = @"\.(css|js|png|jpg|jpeg|gif|svg|ico)$";
        return Regex.IsMatch(path, staticAssetPattern, RegexOptions.IgnoreCase);
    }
}
The middleware is added to the application in the Startup.cs file with a custom extension method, and runs on every request. If it's not for a static asset, it adds to the metric, with the URL of the page being visited. This is then sent to the Aspire Dashboard, where you can see the counter incrementing in real-time.
To view the metric, you can navigate to the Metrics tab in the Aspire Dashboard, and select the UmbObservability.Counts resource. You should see the page.count metric incrementing every time you navigate to a page on the site.
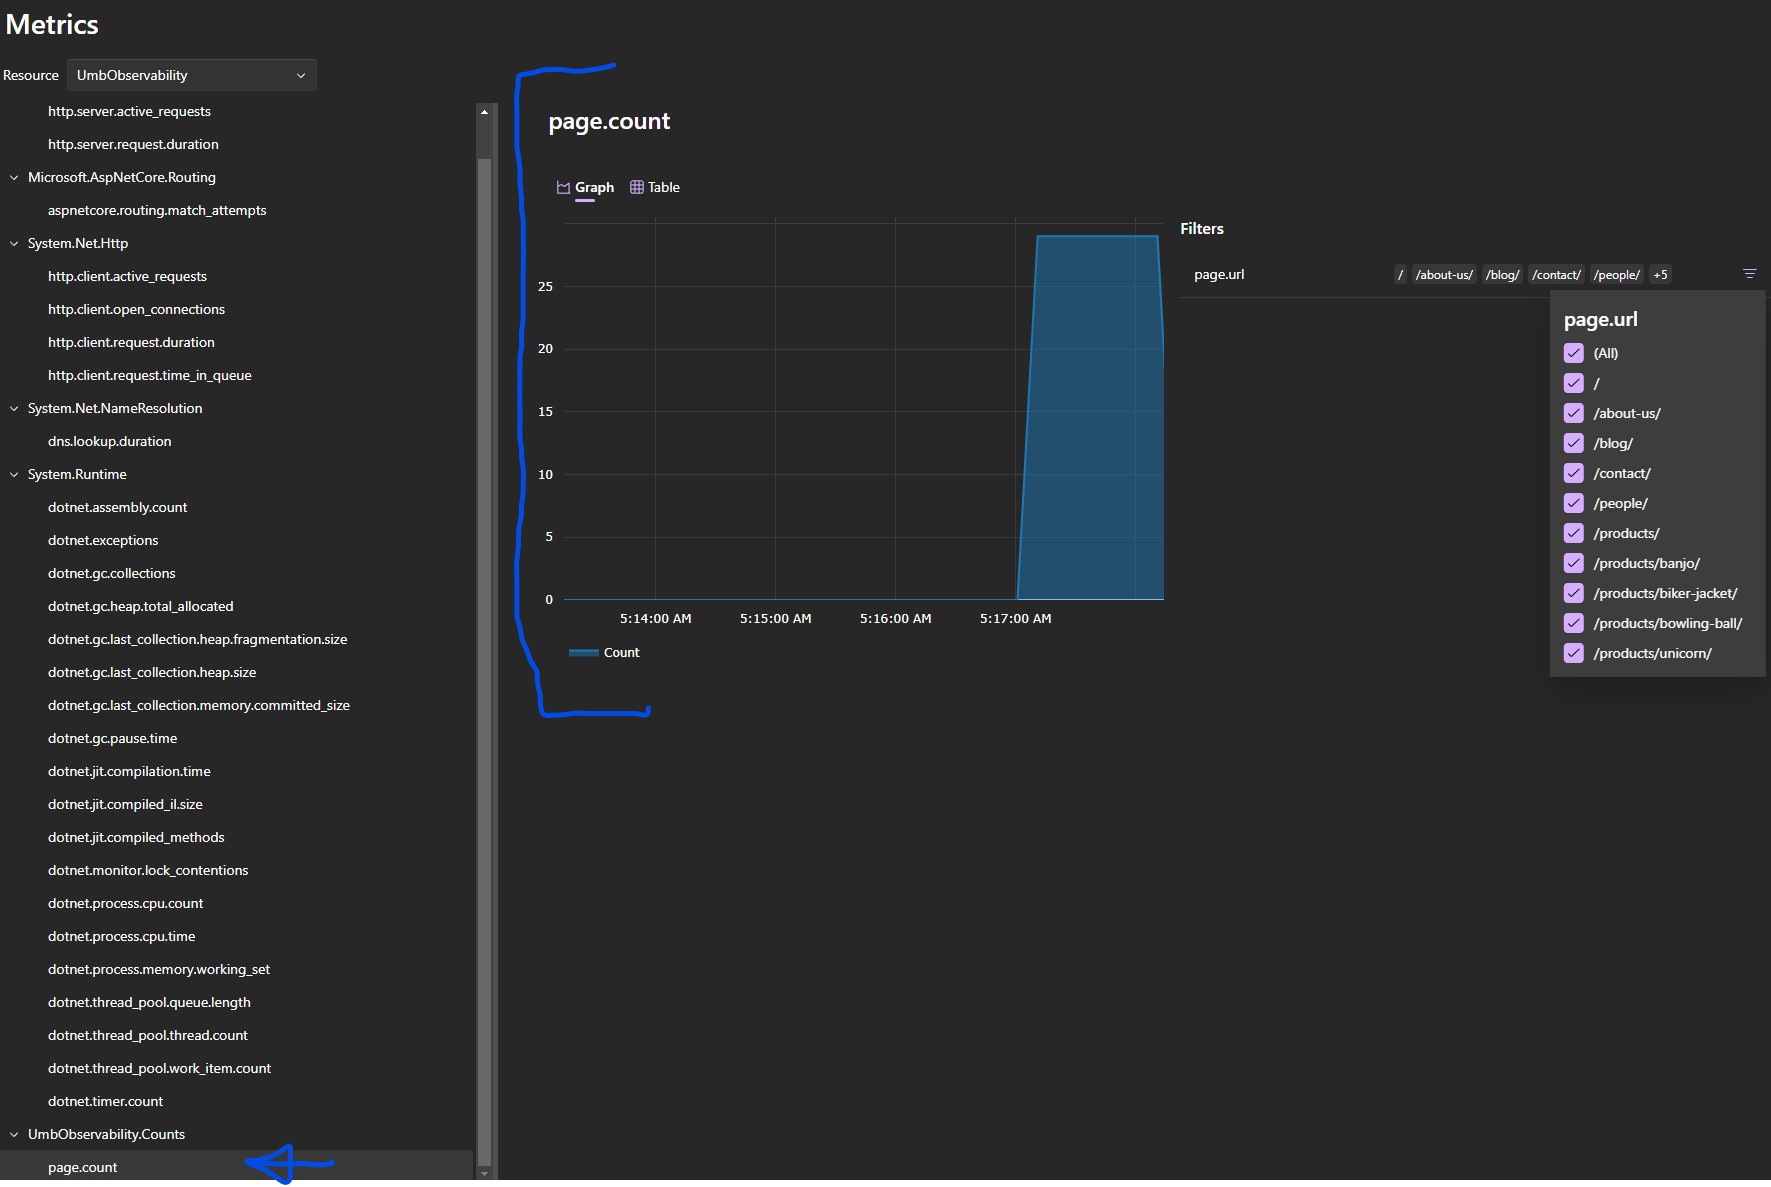
A screenshot of the Aspire Dashboard showing the page.count metric incrementing
You can also filter the metric to only look at specific options, so I can also trave only the product pages by adjusting the filter.
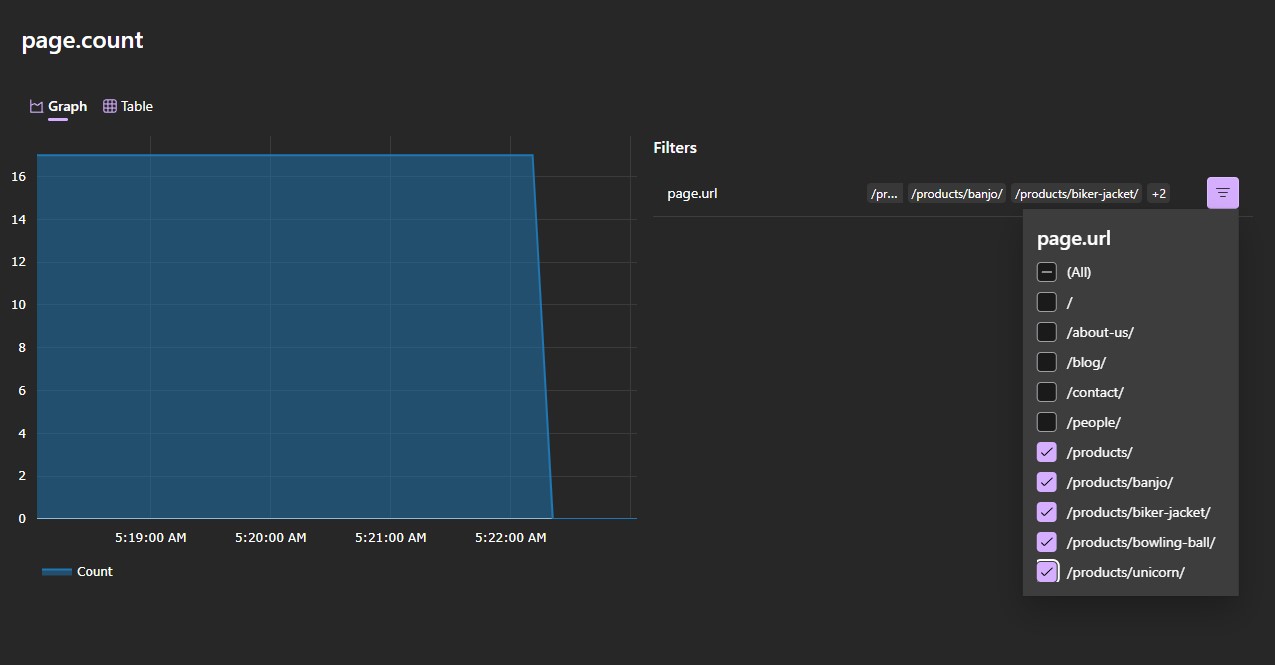
A screenshot of the Aspire Dashboard showing the page.count metric incrementing for product pages only
This data is shown in real-time, and it takes a few seconds for it to update in the aspire dashboard once you navigate to a page. This is a simple example, but you can imagine how you could use this to track the number of requests being processed, the amount of memory being used, or the number of exceptions being thrown in your system.
Traces
Traces are a way of tracking the flow of a request through a distributed system. You can track a request through the system, and see how long it takes to process, where it goes, and what happens to it, and if you have a distributed system, by adding a unique identifier, you can track it between systems. This can help you understand the performance of your system, track down bottlenecks, and even predict when something is going to go wrong.
In the same way as metrics, we can add the traces built into .NET to the Aspire Dashboard, and configure an exporter to send the data to the dashboard. We can then monitor request which pass through multiple controllers, services, and middleware, and see how long they take to process, where they go, and what happens to them. This can help us understand the performance of our system, track down bottlenecks, and even predict when something is going to go wrong.
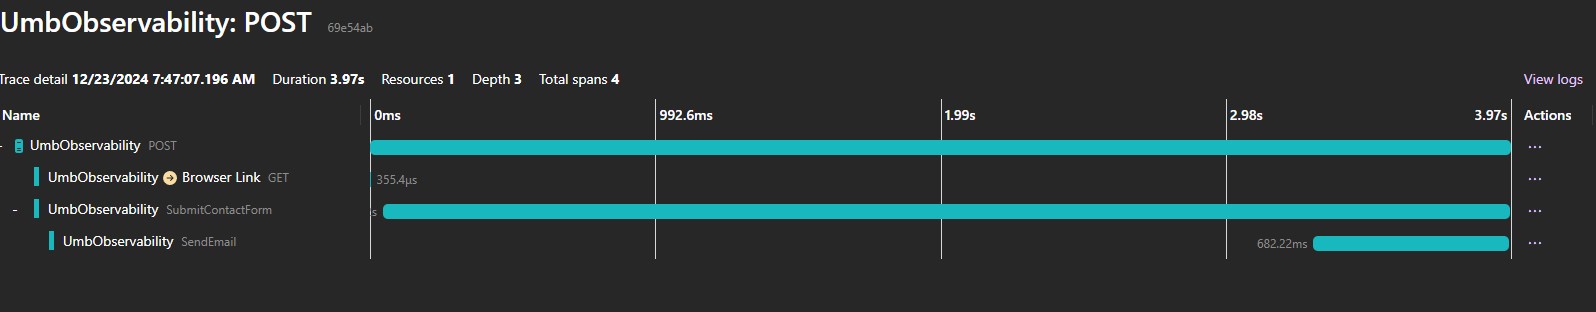
Eg - the following request was for a submission to the contact form, where we can see the request went thrugh the SubmitContactForm Surface Controller, and the EmailService.SendEmail method, and we get additional information with how long each request took to process, and any exceptions that were thrown, and any additional information we added to the trace.
To add this custom trace, I created a Custom ActivitySource, which is a way of grouping related activities together. This is then used to create a custom Activity, which is used to track the flow of a request through the system. The Activity is then sent to the Aspire Dashboard, where you can see it in real-time.
public static class ContactActivitySource
{
    public static readonly ActivitySource ActivitySource = new ActivitySource("UmbObservability.ContactForm");
}
I then added trace information to my controller and services as follows:
// Add trace information to the controller
        using var activity = ContactActivitySource.ActivitySource.StartActivity("SubmitContactForm");
        activity?.SetTag("controller", nameof(Submit));
        activity?.SetTag("form.name", model.Name);
        activity?.SetTag("form.email", model.Email);
And in the service:
// Add trace information to the service
        using var activity = ContactActivitySource.ActivitySource.StartActivity("SendEmail");
        activity?.SetTag("service", nameof(SendEmail));
        activity?.SetTag("email.to", model.Email);
        activity?.SetTag("email.subject", model.Subject);
Obviously this is a simple example, you may should not put personal information in the trace, but you can see how to decorate your traces with additional information, and how to track the flow of a request through your system.
Conclusion
Observability is a powerful tool for understanding the behavior of your system in real-time. By adding metrics and traces to your logging, you can get a much better picture of what's going on in your system, and track down bugs and performance issues much more easily. The Aspire dashboard is a great way to get started with observability locally, and the same code will work with production if you configure the relevant exporters. This article only scratches the surface of what's possible, but hopefully gives you a taster of the sorts of things you can do with observability, and how you can use it to improve the performance and reliability of your Umbraco site.
If you want to read further, I have some links in the references section below. Happy observing!
References
- Open Telemetry
- .NET Aspire Standalong Dashboard
- .NET Observability with Open Telemetry : Prometheus, Grafana, and Jaeger
- Running Umbraco in Aspire
- .NET Aspire sample app
- Observability in .NET