
Go-live of any website is just the beginning. The website is exactly like a newly launched product which has a long way to go before its gets mature enough. While bug fixes, continuous improvements, new features, etc. add to the website beginning to find its feet and mature as a product, what really is key to this journey is to understand how your end users use the website while making sure that the performance is not compromised and any troubleshooting is well aided. This is where Azure Application Insights can come to our help.
Azure Application Insights is one of the features of the wider Azure product - Azure Monitor. Azure Monitor is a comprehensive Azure solution to gather, analyse and act upon telemetry from your cloud and on-premise environments. Application Insights is a feature of Azure Monitor which helps you monitor your applications, help detect any performance issues, keep detailed logs of failures and even gather information about how your users use your application. It takes interest in what happens in your application. Combine it with other features from Azure Monitor, you have a very powerful platform which tell you what happens at your application level and at the infrastructure level. All the data is retained in Azure to give you a good overview about your platform health which can be reported upon using dashboards and and even acted upon using alerts.
Your application being hosted on the cloud is not a requirement for Application Insights, it can be hosted anywhere and can be used to monitor web or even desktop applications. Additionally, if you have multiple components or dependencies to your application like services, databases, etc., all of it can be streamed to a single Application Insights resource.
How to set up Application Insights
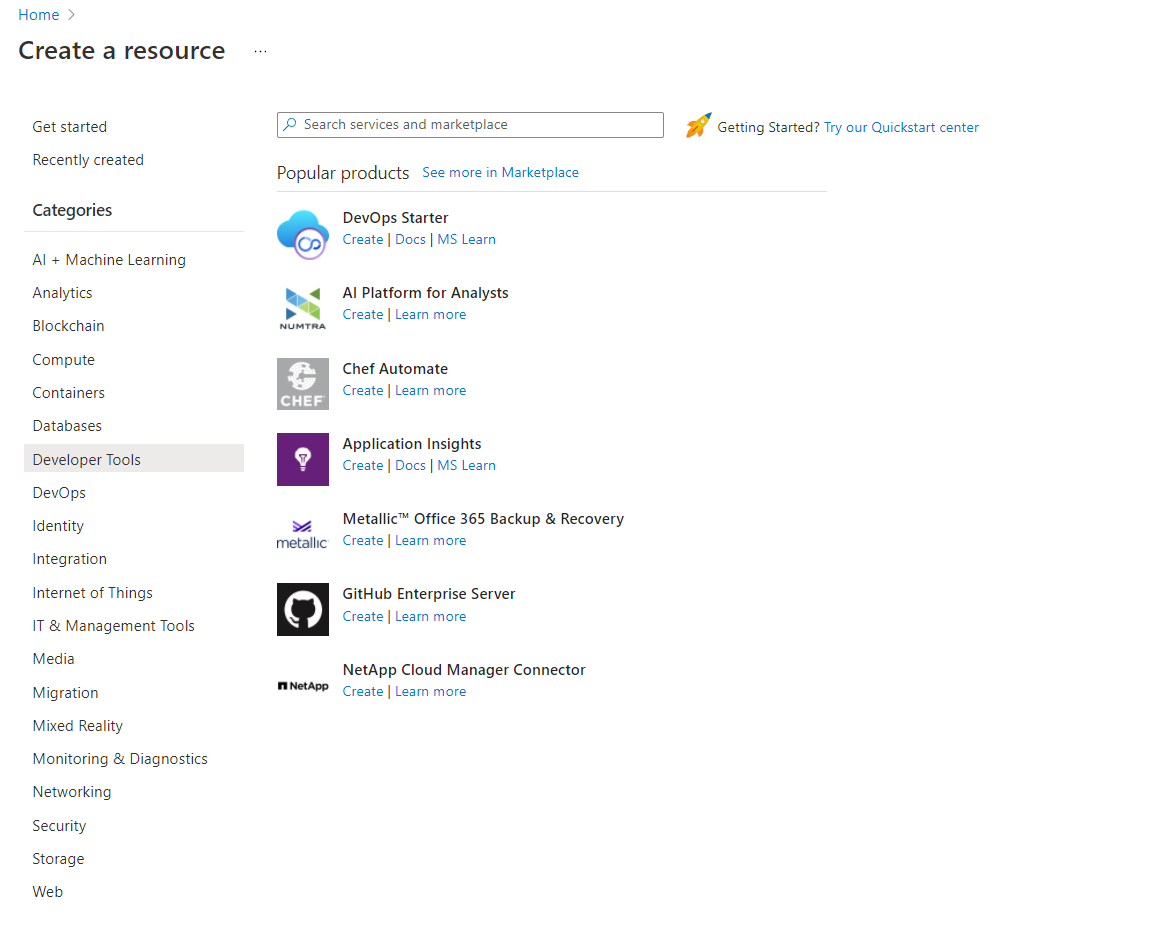
Application Insights is a resource in Azure, so can be created via the portal, using Azure CLI or even ARM templates. So it can be a part of your DevOps pipeline.
When an Application Insights resource is created in Azure, it gets an instrumentation key and a connection string. This connection string can be used to direct any telemetry data to the Application Insights instance. If your website has multiple components like internal APIs all of them can share the same Application Insights resource thus helping you gather end-to-end information about your set up.
Setting up Application Insights in Umbraco
Setting up Application Insights in Umbraco is quite straightforward. Let us see how we can it up for Umbraco.
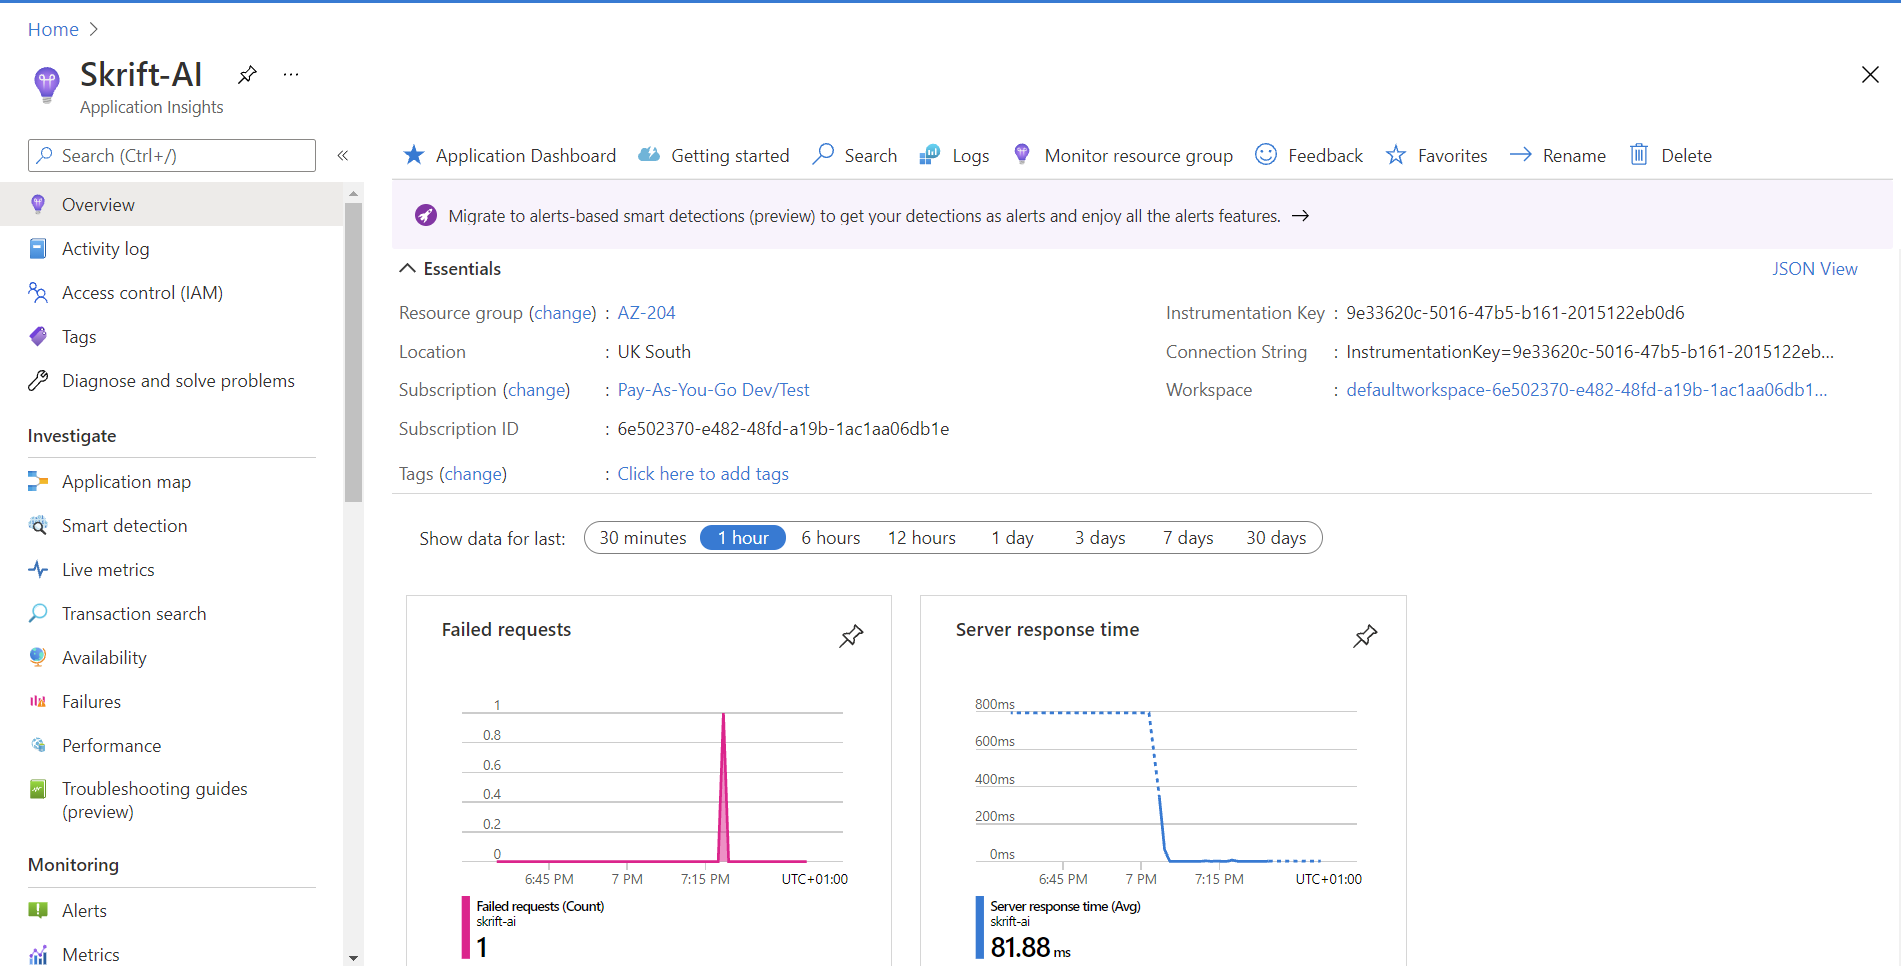
I have already created an Application Insights resource in my Azure subscription. I need to keep a note of the connection string of my resource so that any telemetry data can be directed into my resource.
Let us now start looking at how we can set up Application Insights on an Umbraco 9 and an Umbraco 8 website.
Application Insights on a Umbraco 8 website
To begin with I have set up a a local Umbraco website(v8.17) with the Starter Kit installed. To set up Application Insights, we need to install the Nuget package Microsoft.ApplicationInsights.Web. This installs all the dependent packages as well for you. The connection string which I noted down can be set up as as web.config AppSetting and used in the code.
public class TelemetryComposer : IUserComposer
{
    public void Compose(Composition composition)
    {
        TelemetryConfiguration.Active.ConnectionString  = WebConfigurationManager.AppSettings["APPLICATIONINSIGHTS_CONNECTION_STRING"];
    }
}
That's it! Now if I run the website locally and start clicking through some of the links, I can see the data being tracked into my Application Insights instance.
Application Insights on a Umbraco 9 website
My local set up is a v9 based Umbraco site with the Starter Kit. Set up installations for Umbraco v9 can be found here. Once the website is up and running, I install the package Microsoft.ApplicationInsights.AspNetCore. We are dealing with ASP.NET Core here so we need to register the services in StartUp.cs. This registers:
public void ConfigureServices(IServiceCollection services)
{
    services.AddApplicationInsightsTelemetry();

    services.AddUmbraco(_env, _config)
        .AddBackOffice()
        .AddWebsite()
        .AddComposers()
        .Build();
}
I also need to add my connection string to my appsettings.json.
"ApplicationInsights": {
"ConnectionString": "<connection-string-here>"
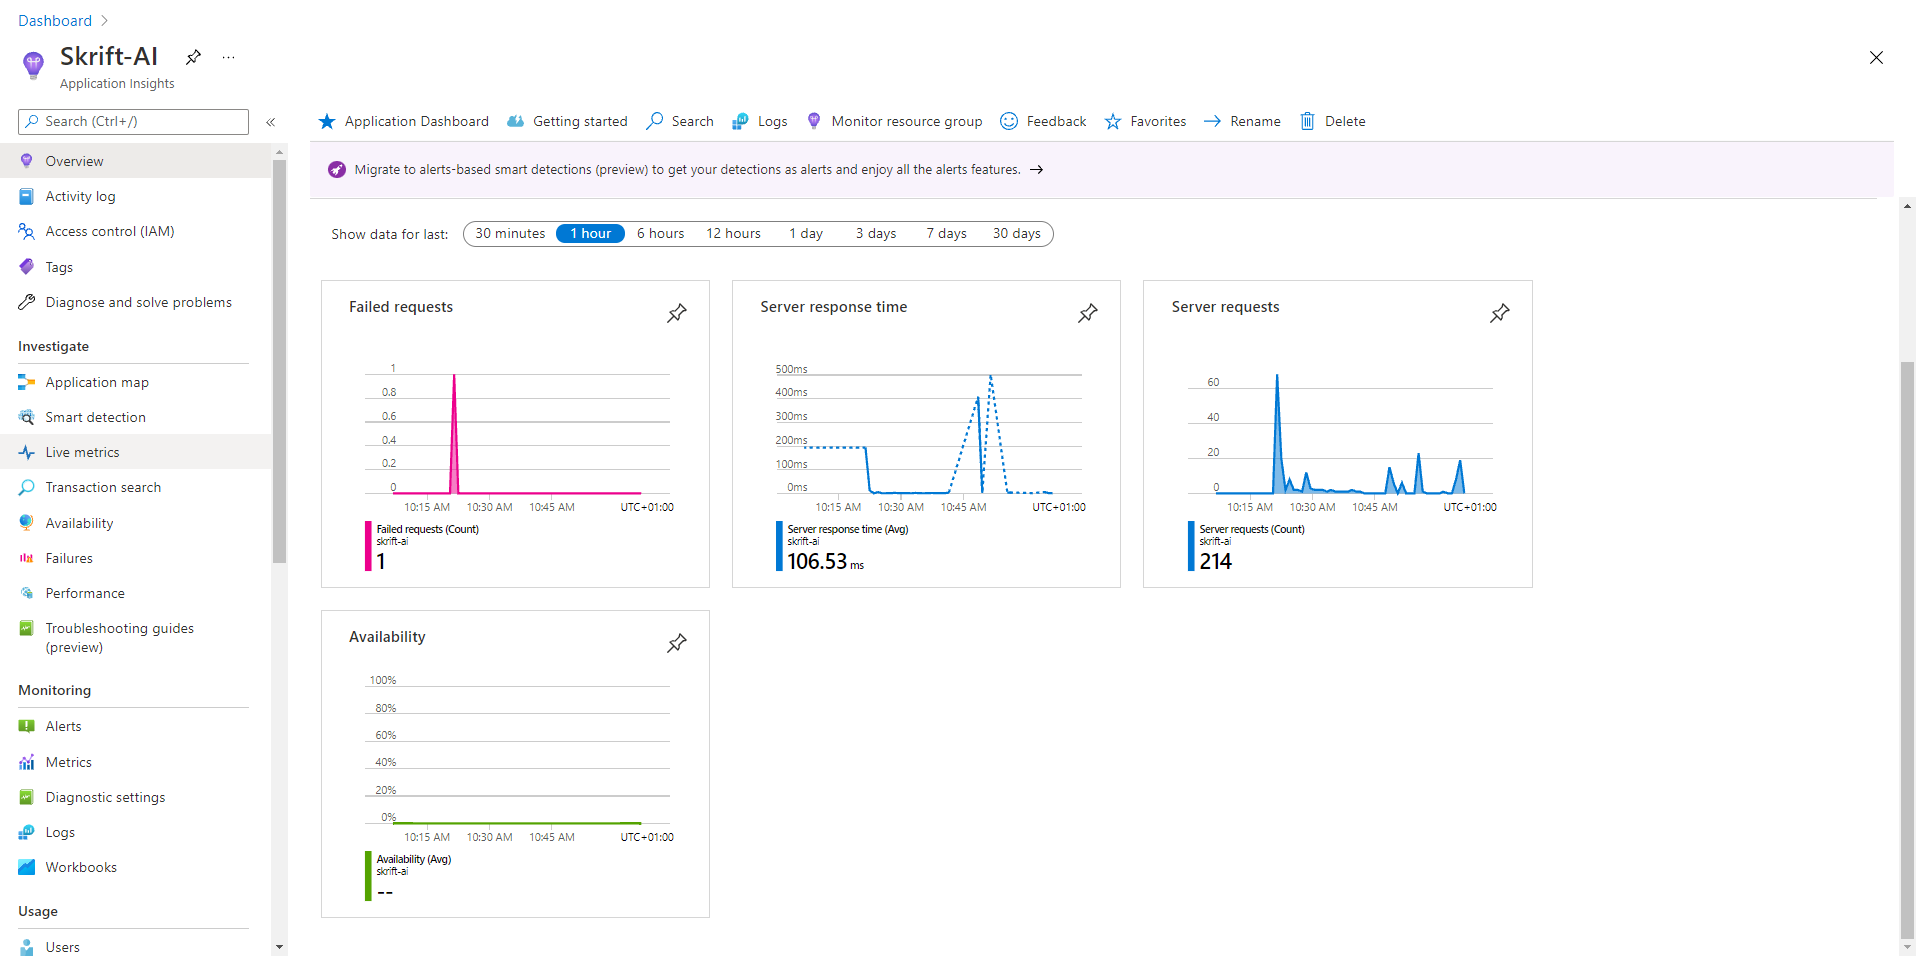
}That is all the set up needed. Now if I run my website and browse through it and then visit the Azure Portal, I can see that telemetry from the local website is directed to my Application Insights instance.
I will be using my Umbraco 9 set up to explain some of the features of Application Insights further.
What is logged into Application Insights?
With the above set up, all the requests, tracing, exceptions, etc. gets logged into Application Insights. The Umbraco logs, i.e., App_Data\Logs still remain with Serilog. To have Umbraco logs directed to Application Insights, you will need to install the Serilog sink for Application Insights using the package Serilog.Sinks.ApplicationInsights. More information about the package can be found here.
Application Insights in a bit more detail
Now that we have spoken about the set up in Umbraco, let us have a closer look few features of Application Insights. I know I won't be able to cover all grounds here but I hope to give you a good overview of some of the features I find really cool.
Application Map
Application map is a fantastic feature of Application Insights. It gives you a visual map of your application along with any dependencies like your APIs, any-third party services, SQL databases etc. Of course third-party services and databases cannot be tracked with Application Insights but the map can show the dependencies visually, track the requests and responses from them thus helping you understand user flows.
Let us see the Application Map for my current set up with Umbraco 9.My local set up consists of my IIS hosted Umbraco 9 instance connected to my local SQL server and as you can see it has identified my set up, only from the telemetry data that is being tracked by Application Insights.
Right after installation with the instrumentation key in place and a few clicks of the my local install, I wait for a few minutes and Application Insights shows me this application map. This information is gathered by Application Insights upon the start up of the application. The various parts of your application like external services, SQL databases etc are discovered by the feature following the HTTP calls made by the application. And that is what exactly is revealed here. The circle with "1 instance" denotes that there is one instance of something tracking the data to this particular Application Insights resource which in my case is Umbraco9. All other parts are third-party services including my SQL server database which does not track to my Application Insights resource but still it has managed to present me with the diagram that is shown below which is a superb overview of all the services that my local Umbraco 9 install is connected to.
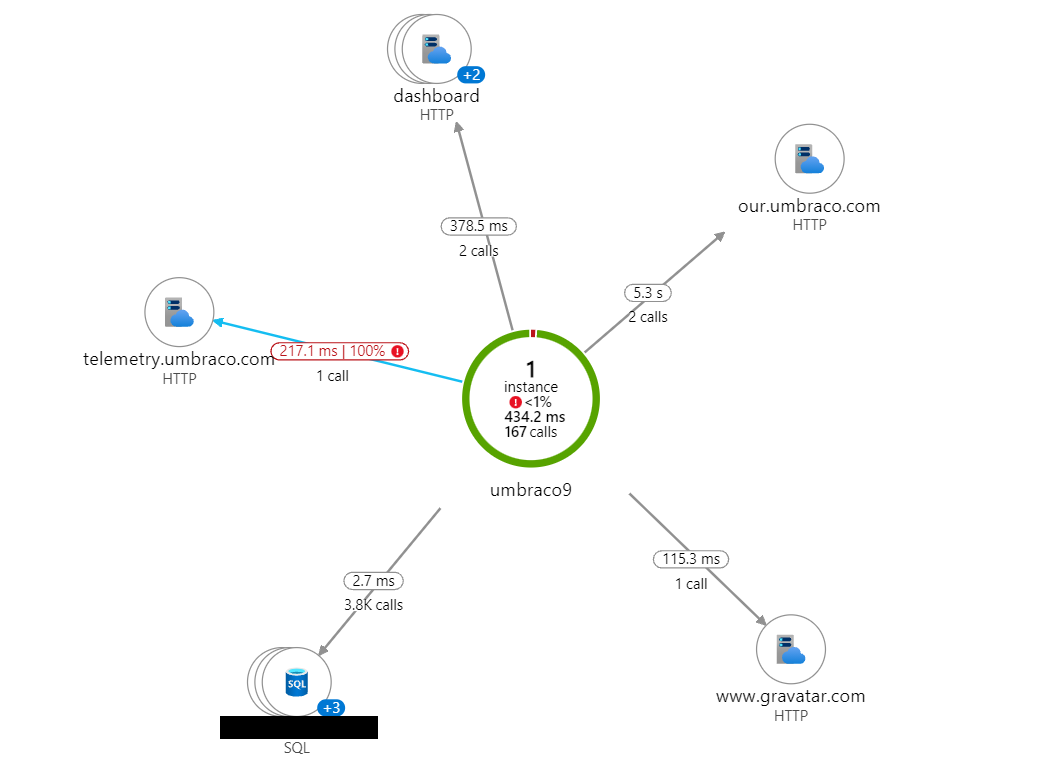
I can further click on any of the components and understand further details like the failures, performance of requests. I can drill down further from here and get much more detailed information about each of these, but more on that later.
Now let me add an Azure Function into the mix, I have set up a Function App in the portal with Application Insights enabled and tracking to the same resource as above. So now I have my local Umbraco install as well as my Function App tracking to the same Application Insights resource. With Application Insights enabled, Azure functions direct all the logs, traces, any exceptions and performance data. I have also created a very basic function in my function app using the Code Editor in the Portal.
#r "Newtonsoft.Json"

using System.Net;
using Microsoft.AspNetCore.Mvc;
using Microsoft.Extensions.Primitives;
using Newtonsoft.Json;

public static async Task<IActionResult> Run(HttpRequest req, ILogger log)
{
    log.LogInformation("C# HTTP trigger function processed a request.");

    string name = req.Query["name"];

    string requestBody = await new StreamReader(req.Body).ReadToEndAsync();
    dynamic data = JsonConvert.DeserializeObject(requestBody);
    name = name ?? data?.name;

    string responseMessage = "Hello from Azure Function to Umbraco";

    return new OkObjectResult(responseMessage);
}
Now if I go back to my Application Map, it should start showing be a second instance. This second instance is my function app which is tracking to my Application Insights resource. As before I can click on the instance to view the details. Now let me try to call this Azure Function from my local Umbraco install and see what happens.
I have created a ViewComponent for this. My ViewComponent reaches out to my Azure function and:
public class CallAzureFunctionViewComponent : ViewComponent
    {
        private readonly HttpClient _httpClient;

        public CallAzureFunctionViewComponent(HttpClient httpClient)
        {
            _httpClient = httpClient;
        }

        public async Task<IViewComponentResult> InvokeAsync()
        {
            var response = _httpClient.GetAsync("https://test-appinsights.azurewebsites.net/api/Umbraco9-Function");
            var text = await response.Result.Content.ReadAsStringAsync();

            return View<string>(text);
        }
    }
The view for this ViewComponent is a pretty simple one and is called Default.cshtml. It resides in the folder Views/Shared/Components/CallAzureFunction following the naming convention specified here.
@model string

<p>@Model</p>
I finally invoke my component in the Master.cshtml. I have placed it in the footer so that the text is shown in the footer of the site.
@(await Component.InvokeAsync("CallAzureFunction"))Run my local Umbraco instance, browse through the pages and wait a few seconds, I can see all this tracked into my Application Map.
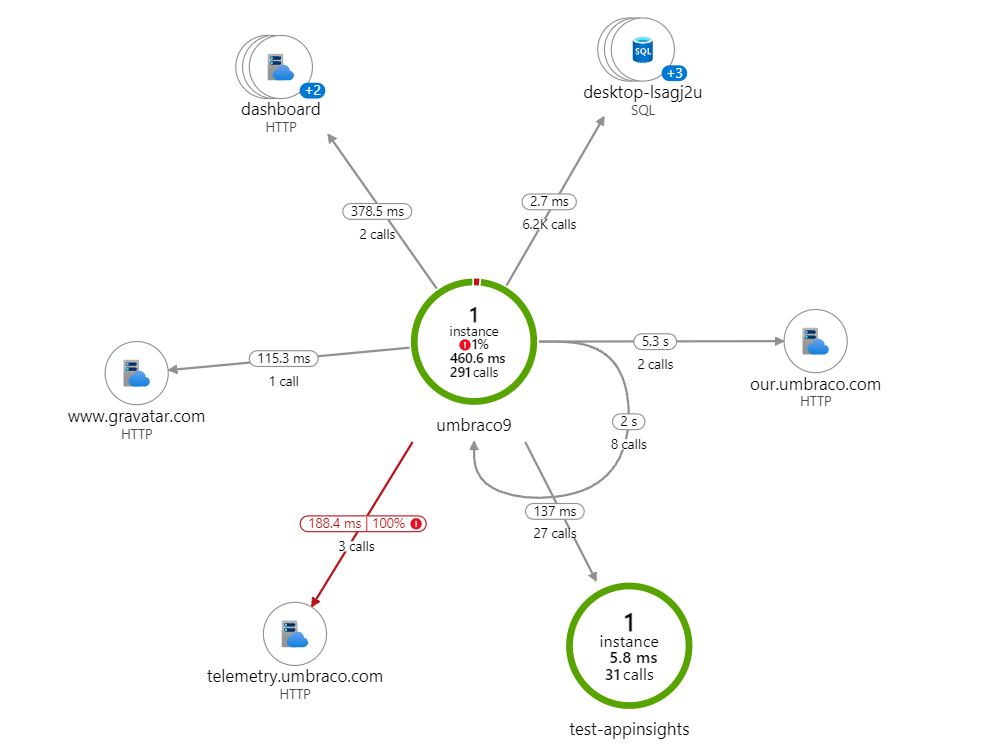
I can drill down further into my requests and see what is going on. But what is most important here is that Application Insights has managed to give me a bird's eye view of my website and dependencies and this can be a superb documentation in itself to understand about high-level architecture of a system. It also highlights the number of calls and even the errors which I can dig deeper into and investigate for failures.
Live Metrics
Another useful feature of Application Insights is Live Metrics which can be very useful for real-time monitoring of your application. I have used this personally to monitor some high-traffic websites during their peak hours. It gives you real-time information about incoming requests, health and outgoing requests all of which are extremely useful while monitoring in real-time. Another area where it can be useful is while load testing. You get to know how the website performs, what is the failure rate like, and even drill down to check the details around failures.
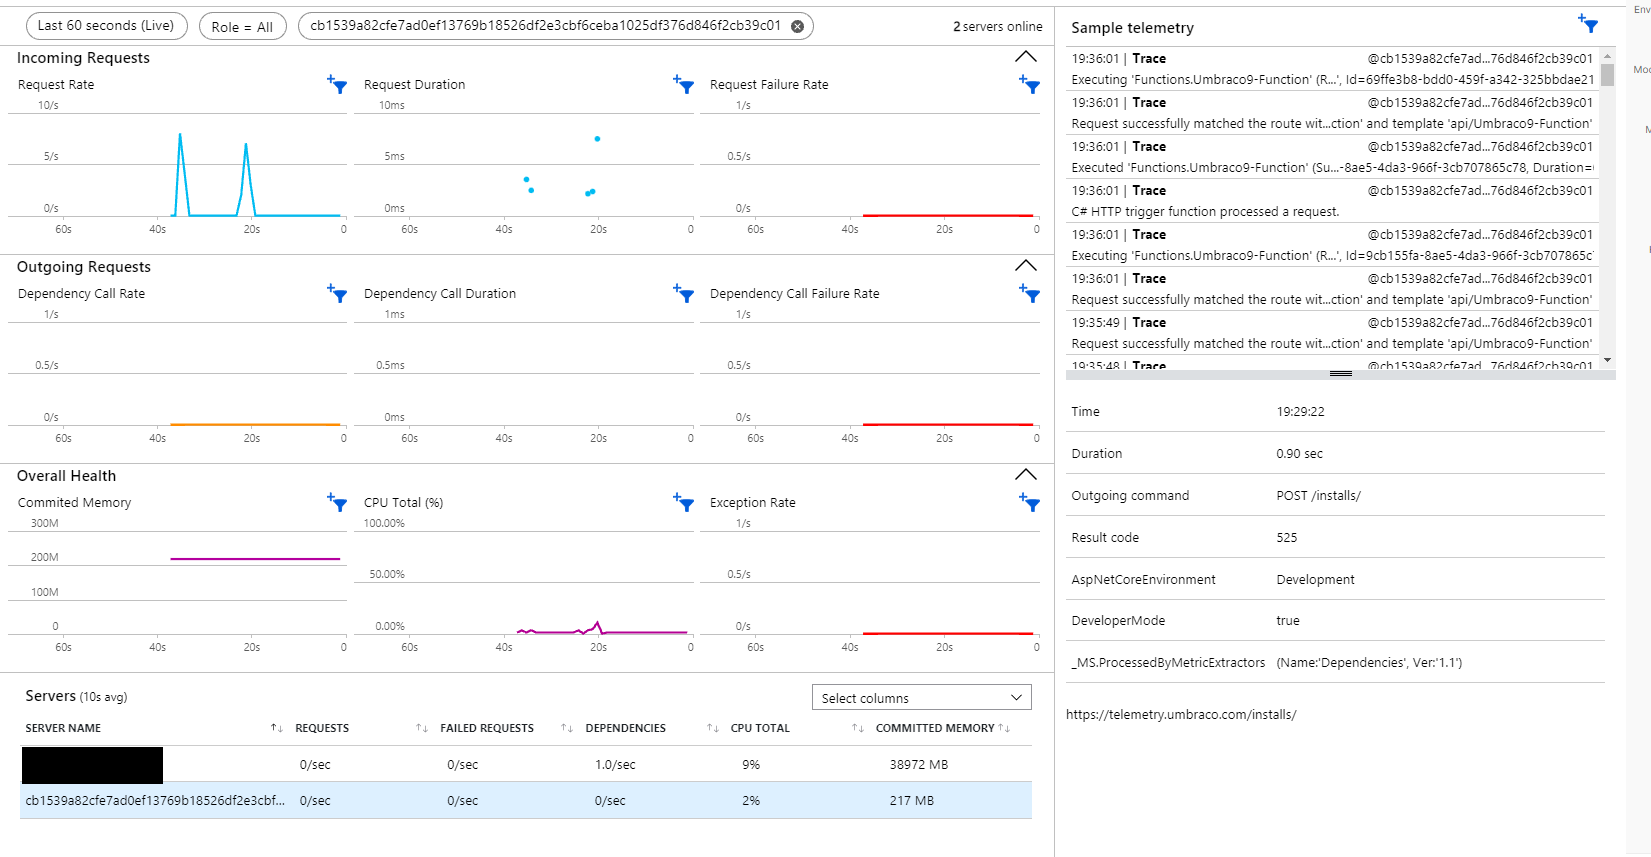
The live metrics stream also identifies the servers which are tracking to my Application Insights resource - the function app and my local machine in this case. I can further filter down telemetry from each of these servers and monitor it real-time. Again something that can be useful when you have many parts and if you are closely monitoring a particular part post a deployment or a bug fix.
Failures
Now that we have spoken about failures with Live Metrics let us see how Application Insights can help us understand information around failures. I have tweaked my ViewComponent to introduce a typo into my function url.
public class CallAzureFunctionViewComponent : ViewComponent
{
private readonly HttpClient _httpClient;
public CallAzureFunctionViewComponent(HttpClient httpClient)
{
_httpClient = httpClient;
}
public async Task<IViewComponentResult> InvokeAsync()
{
try
{
var response = _httpClient.GetAsync("https://test-appinsights.azurewebsites.net/api/Umbraco9-Functio");
var text = await response.Result.Content.ReadAsStringAsync();
return View<string>(text);
}
catch(Exception ex)
{
return Content(string.Empty);
}
}
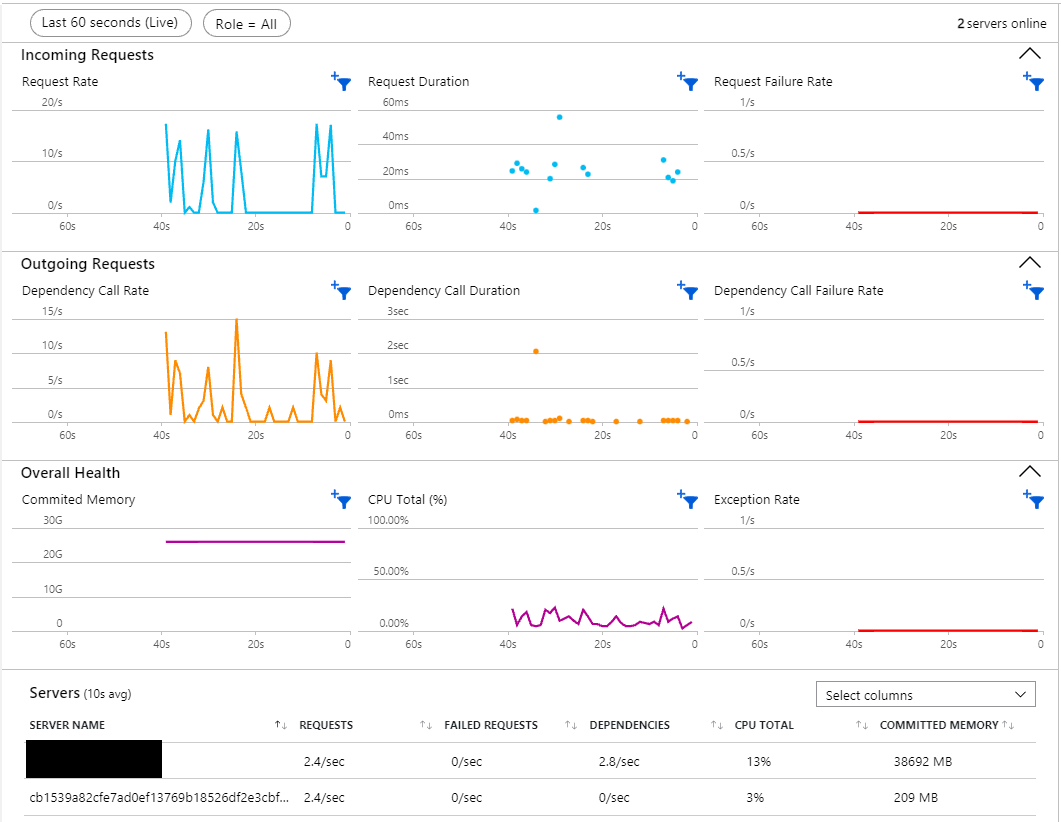
}My website functions as normal but I no longer see the ViewComponent being rendered. Live metrics can show you real time errors but in most of the cases we are required to take action after an error occurs. And to understand what is happening I can go into the "Failure" option in Application Insights. And that shows me information about the recent failures. I can click on each of the operation name in the left panel and that shows me what errors I have encountered.
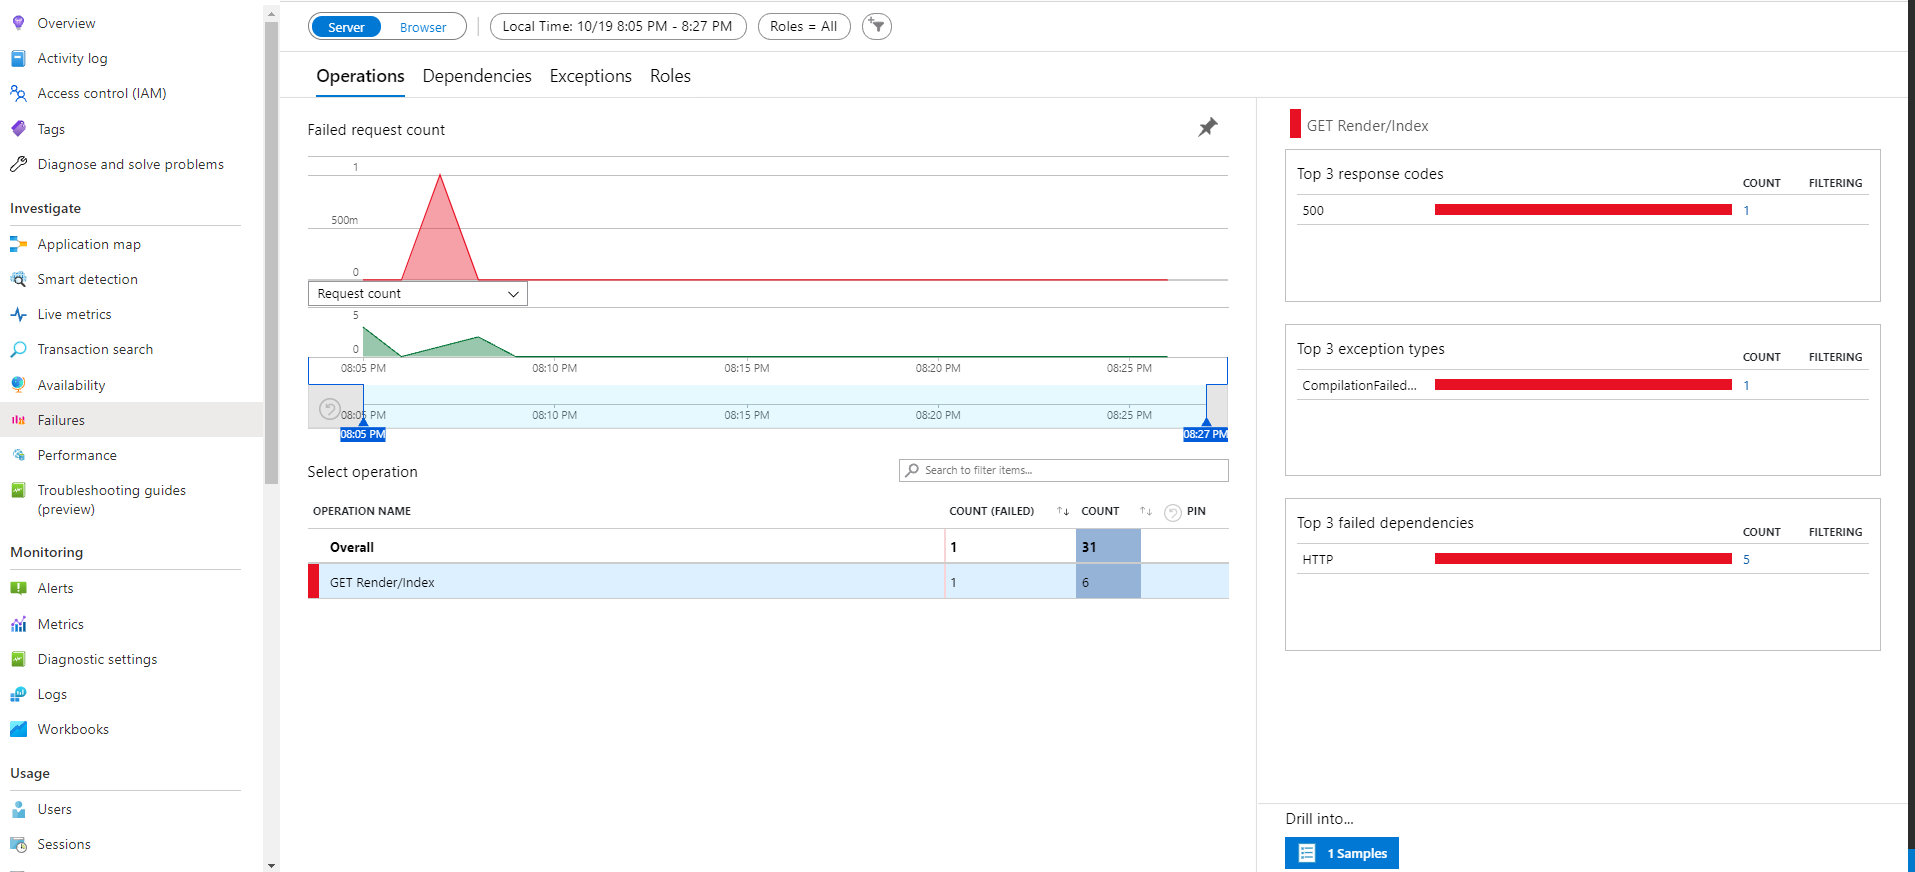
I am particularly interested in the dependency failure here as I know my ViewComponent displays the text that my function app returns. I can drill through the failed dependency and see further details.
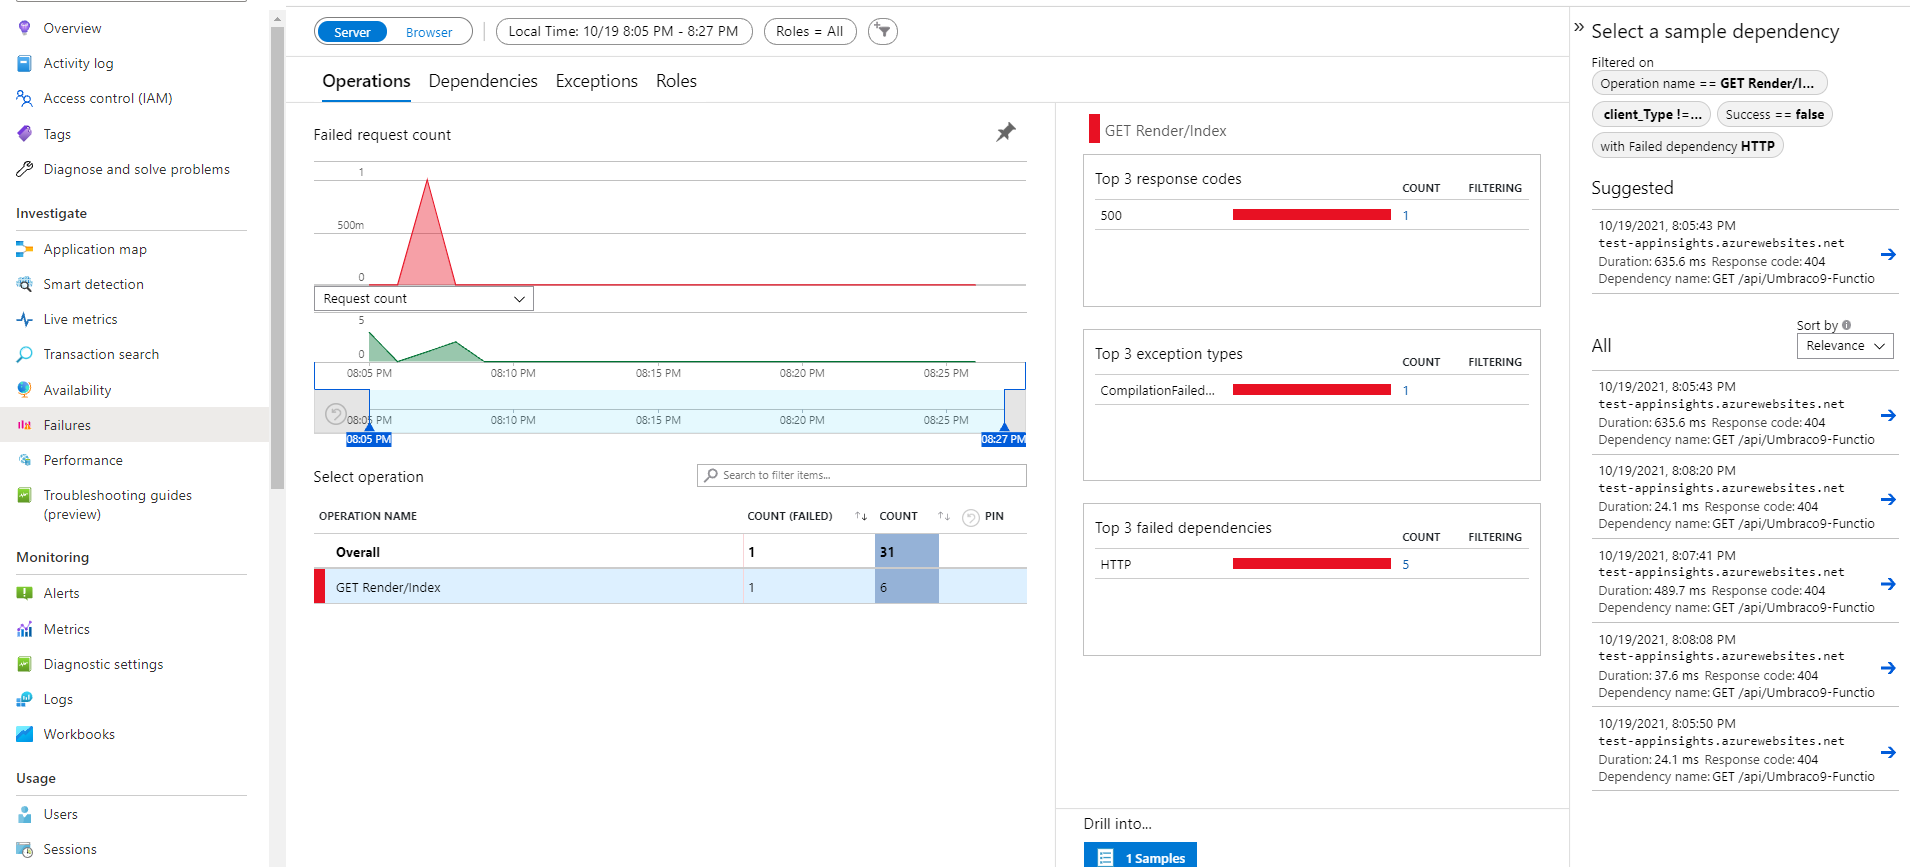
Each of the sample dependency can be further examined for the details as well which gives me enough details to figure out what is going on in my code.
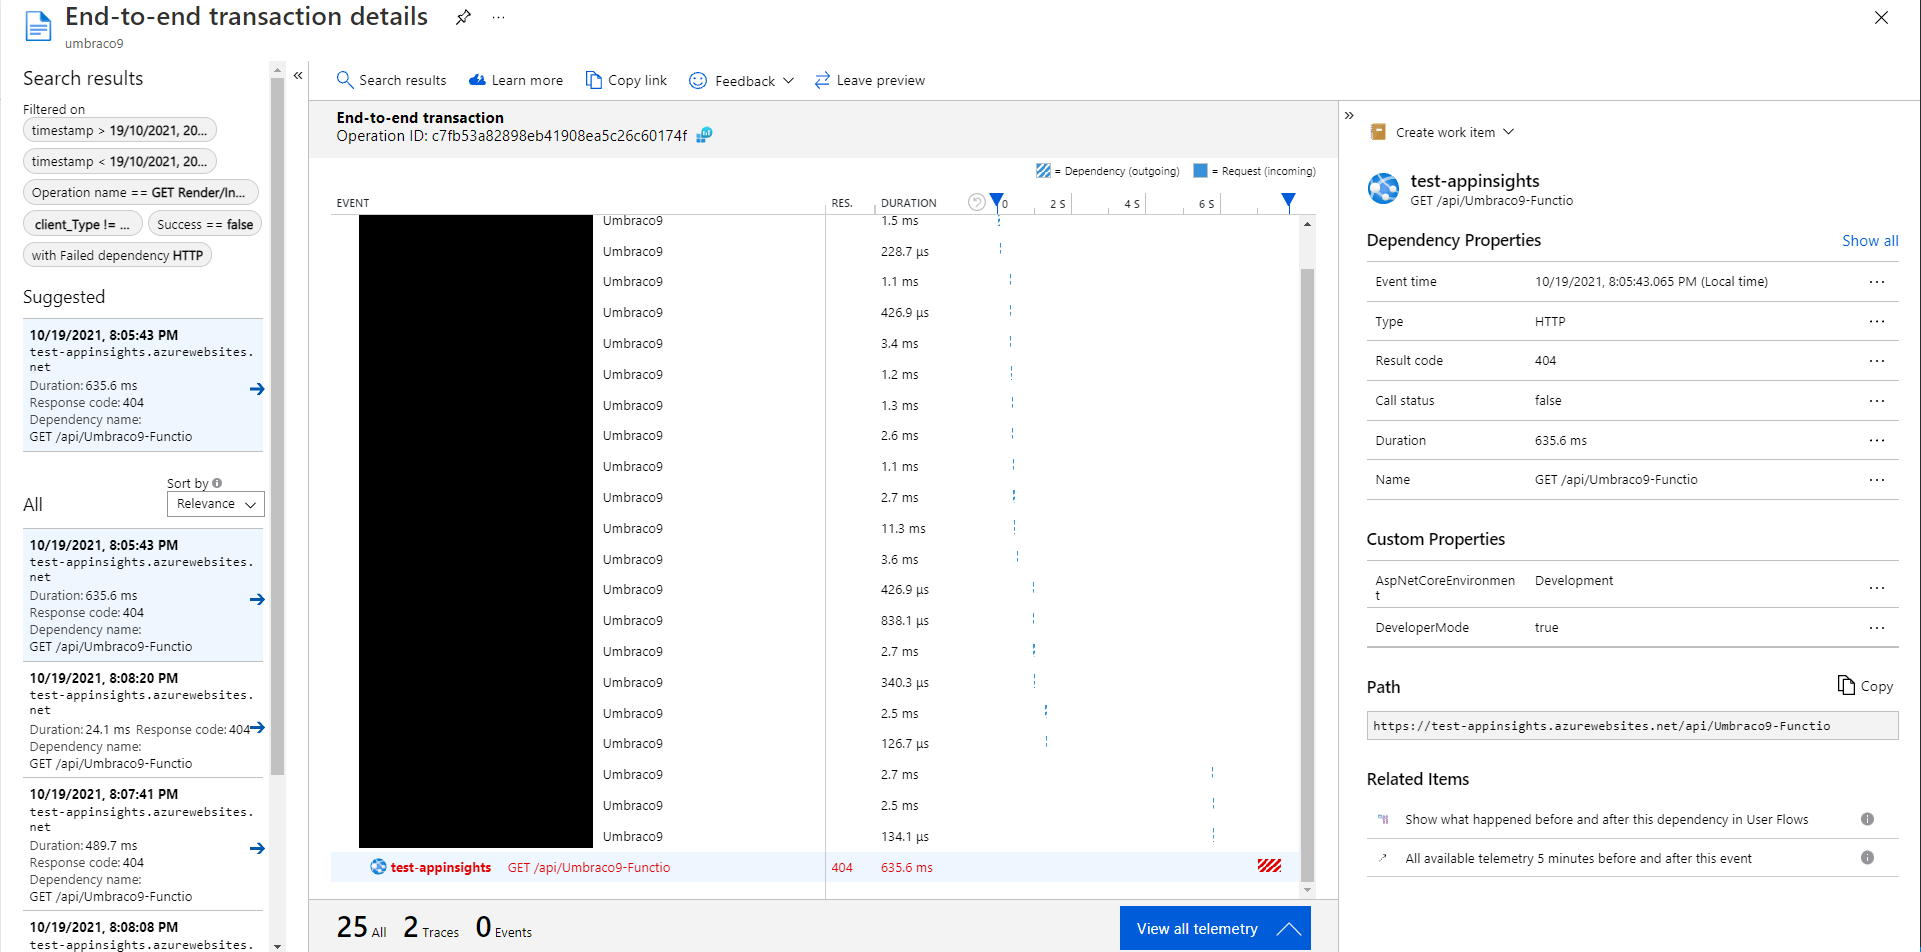
This is quite a powerful feature as it gives me the entire timeline of that particular request
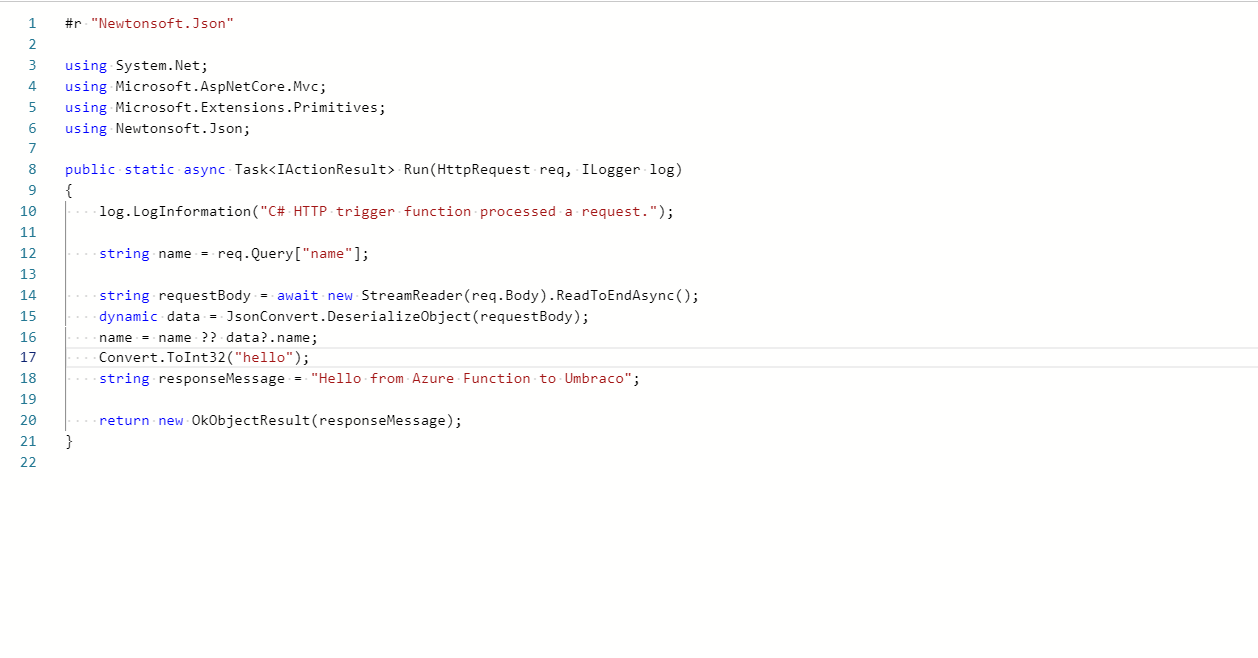
Now let me introduce a bug in my Azure Function as shown below. I have tried a integer conversion on a string that is bound to fail.
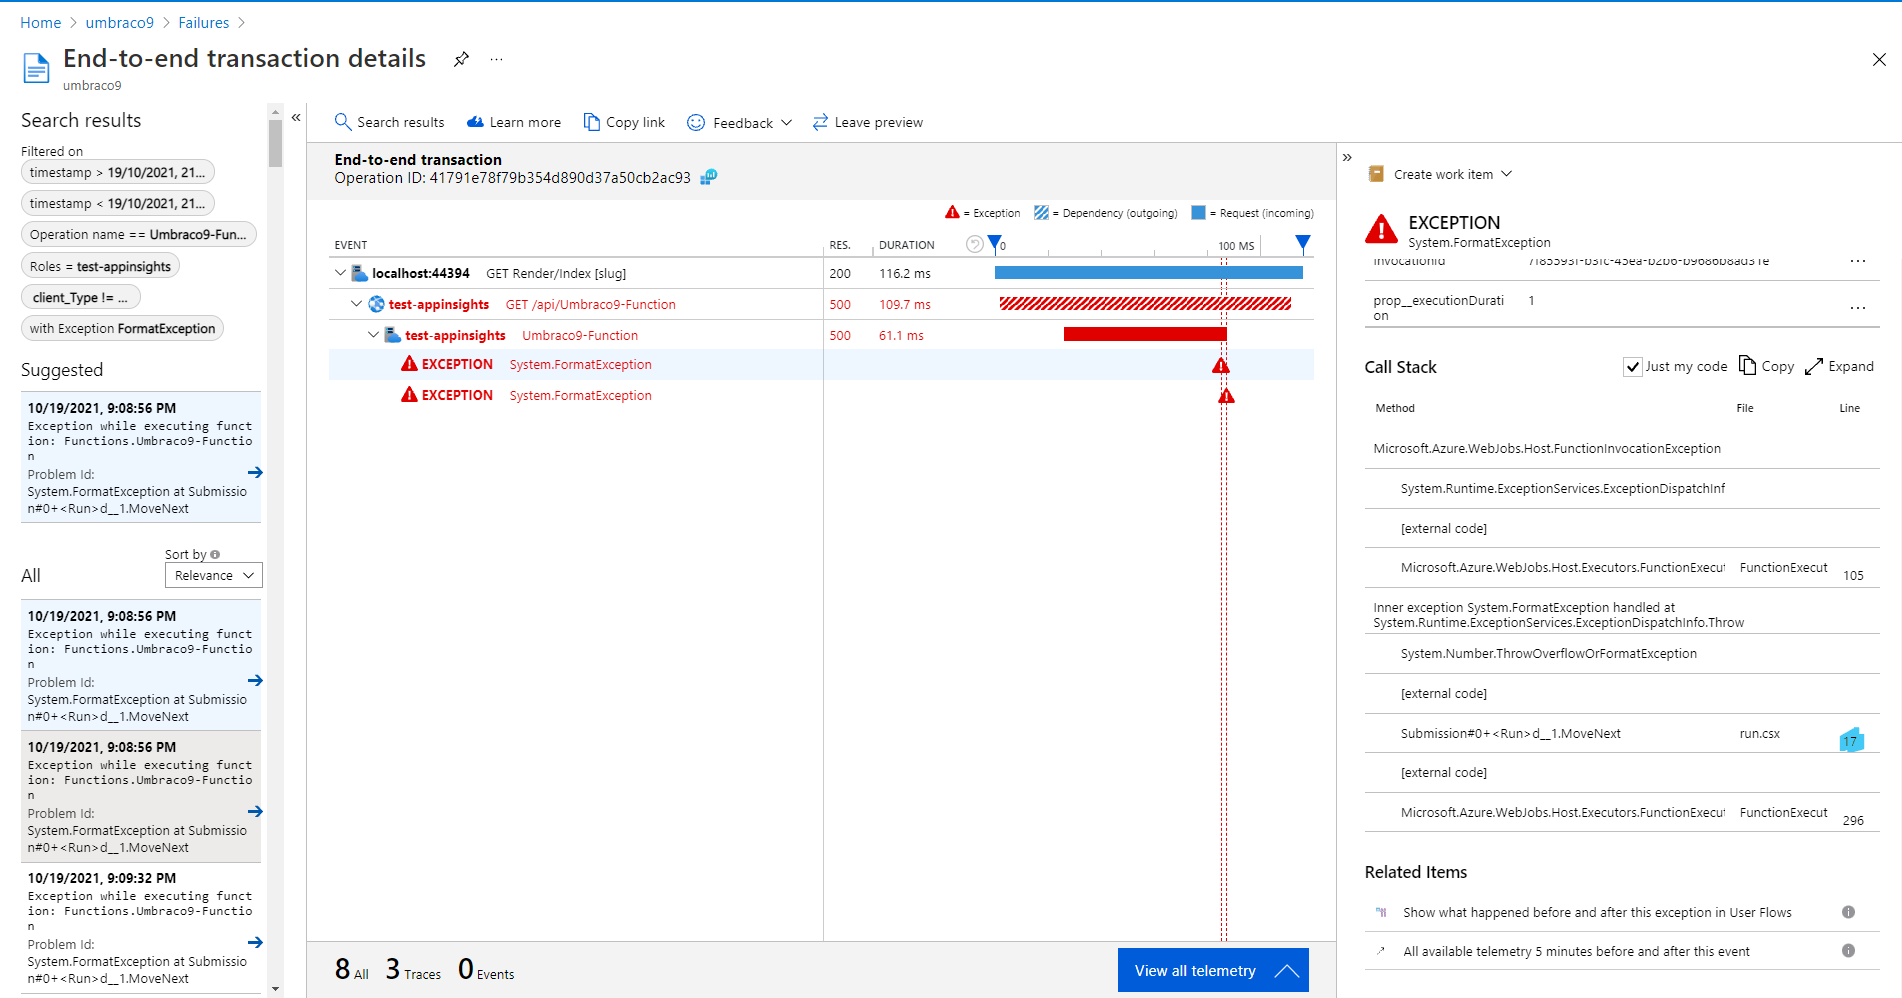
My ViewComponent again does not render and the Failures tab gives me enough information about the exception which I can drill down and investigate.
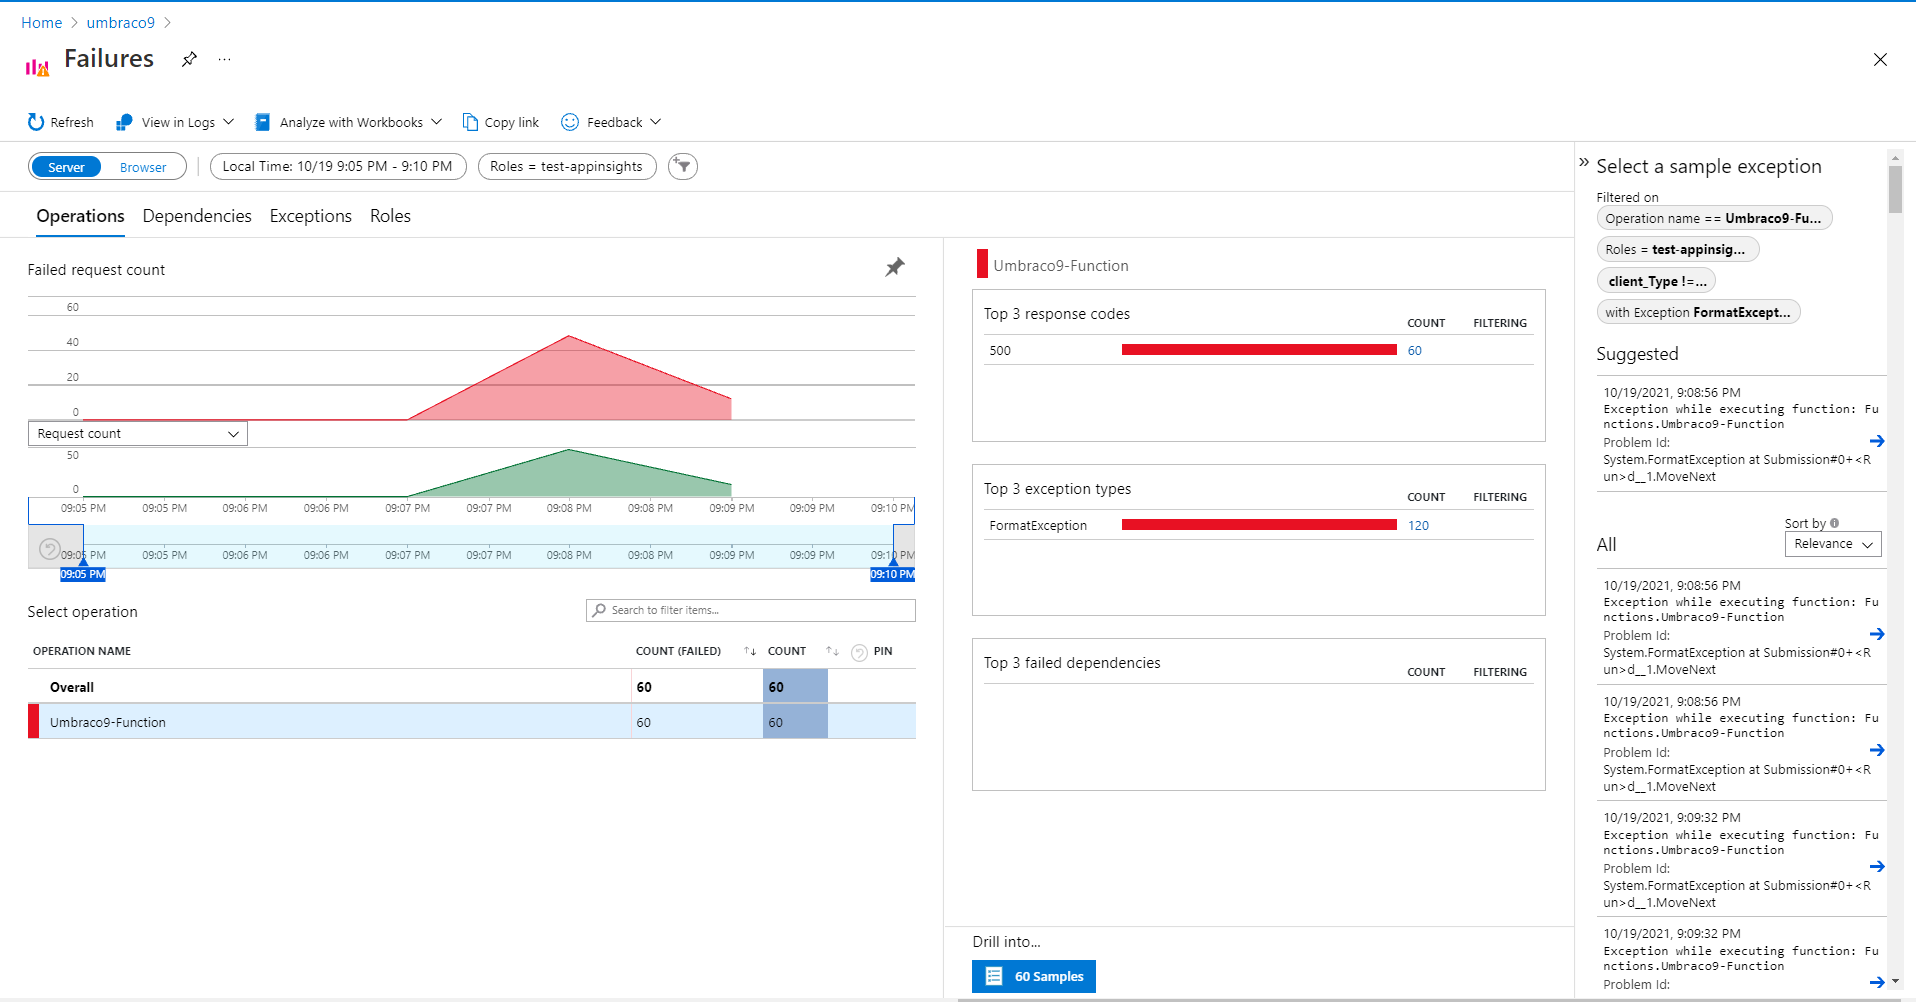
I can examine the exception in greater detail to see the call stack. There is a "Just my code" option by the detailed call stack which can even tell me the line number at which my code has failed. This is incredibly powerful and useful information which can then be actioned. The call stack can pin point where exactly the issue lies and can save a lot of time that might otherwise be spend on debugging an issue.
Note: 404 errors can result in a huge amount of data logged into Application Insights. You can see how to exclude 404s from being logged here.
Transaction Search
Transaction Search can help you find and analyse individual items like page views, requests, exceptions, traces, dependency calls, custom events etc.
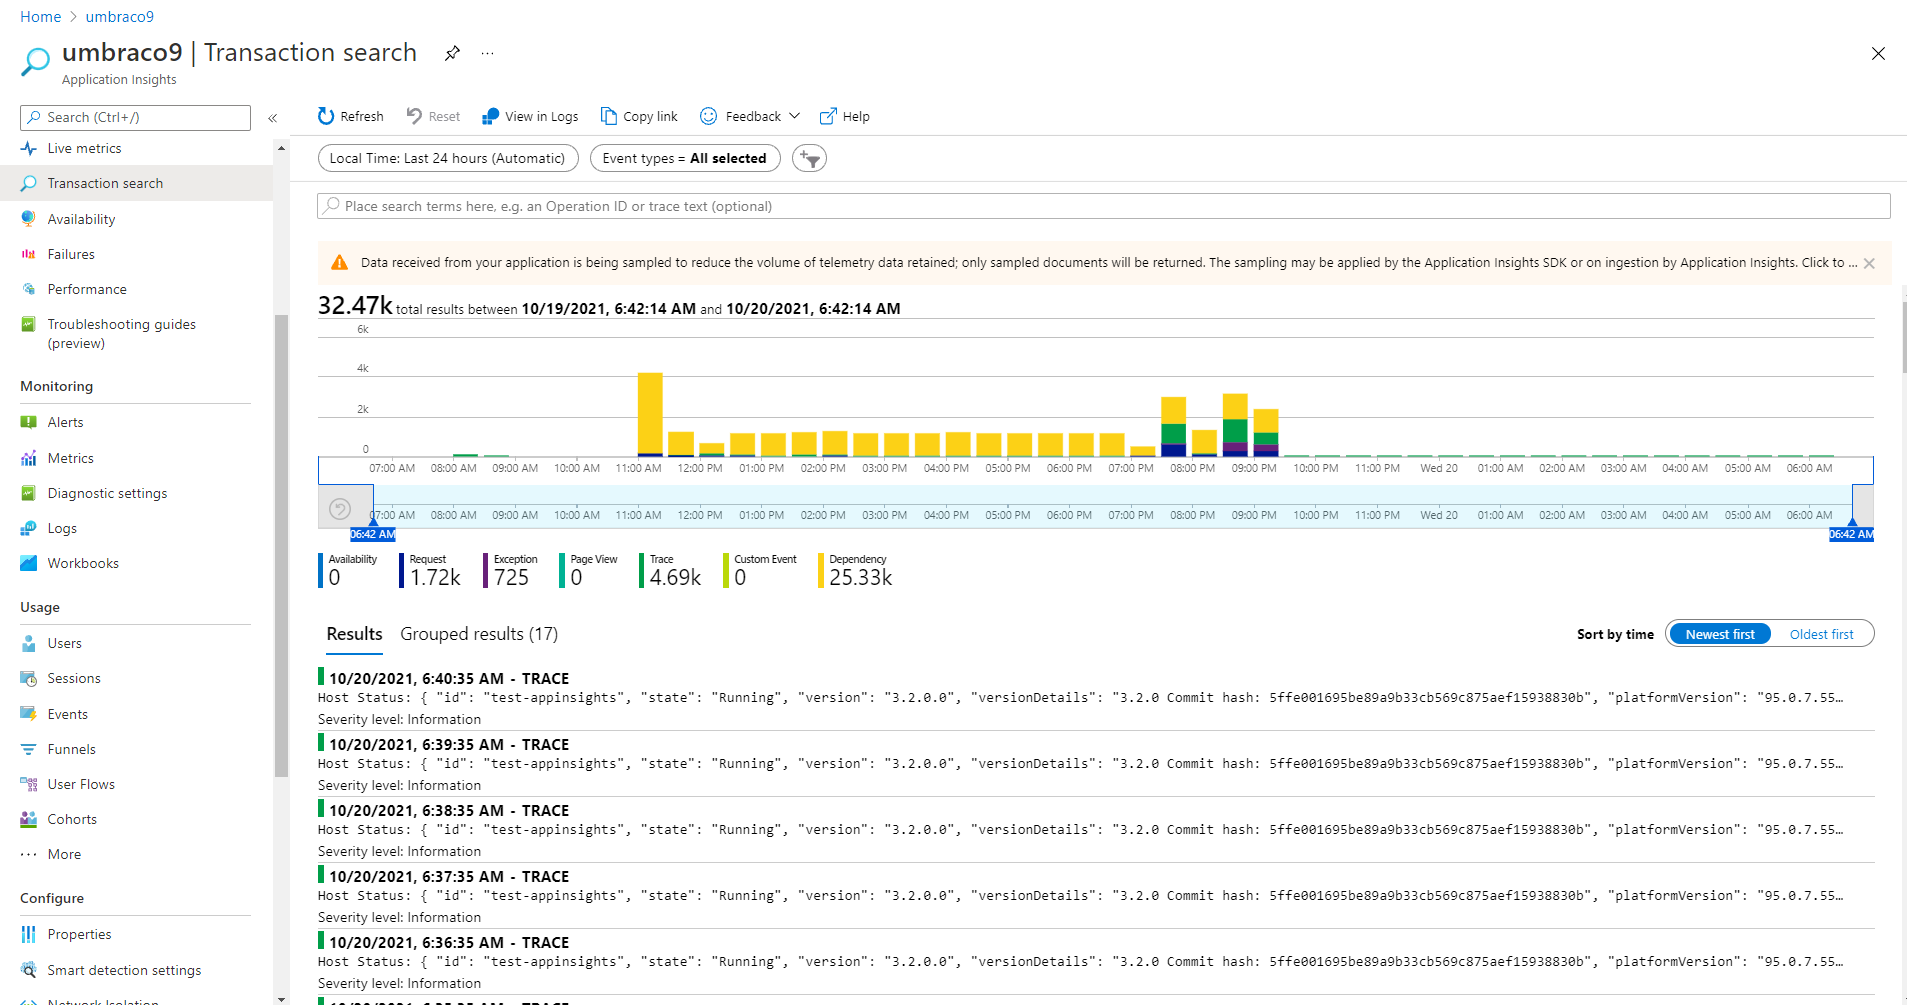
I can filter on the data or even see grouped results based on their type. Its another feature I have used to understand some transactions. Say you have a complex workflow with calls to other services, appropriate logging can ensure that you have all the data in place to troubleshoot your website should anything go wrong.
To have a look at how this can help, I have amended my function code to log about the querystring value it receives in the HttpRequest.
#r "Newtonsoft.Json"

using System.Net;
using Microsoft.AspNetCore.Mvc;
using Microsoft.Extensions.Primitives;
using Newtonsoft.Json;

public static async Task<IActionResult> Run(HttpRequest req, ILogger log)
{
    log.LogInformation("C# HTTP trigger function processed a request.");

    string name = req.Query["name"];

    string requestBody = await new StreamReader(req.Body).ReadToEndAsync();
    dynamic data = JsonConvert.DeserializeObject(requestBody);
    name = name ?? data?.name;

     log.LogInformation($"Processing for name {name}");

    string responseMessage = $"Hello from Azure Function to Umbraco and {name}";

    return new OkObjectResult(responseMessage);
}
I have also enhanced logging in my ViewComponent, writing to the logs about the value that I use to make a call to my function.
public class CallAzureFunctionViewComponent : ViewComponent
    {
        private readonly HttpClient _httpClient;

        private readonly ILogger<CallAzureFunctionViewComponent> _logger;

        public CallAzureFunctionViewComponent(ILogger<CallAzureFunctionViewComponent> logger, HttpClient httpClient)
        {
            _logger = logger;
            _httpClient = httpClient;

        }

        public async Task<IViewComponentResult> InvokeAsync()
        {
            try
            {
                var name = "7b97449e-e1ef-4e72-9d85-34980a485b8e";
                _logger.LogInformation($"Component invoked for name {name}");
                var response = _httpClient.GetAsync($"https://test-appinsights.azurewebsites.net/api/Umbraco9-Function?name={name}");
                var text = await response.Result.Content.ReadAsStringAsync();
                return View<string>(text);
            }
            catch(Exception ex)
            {
                return Content(string.Empty);
            }
        }
    }
Run the website and a couple of clicks to collect the telemetry data. Umbraco logs are still in my App_Data folder but I have information about the value I used in my component logged.
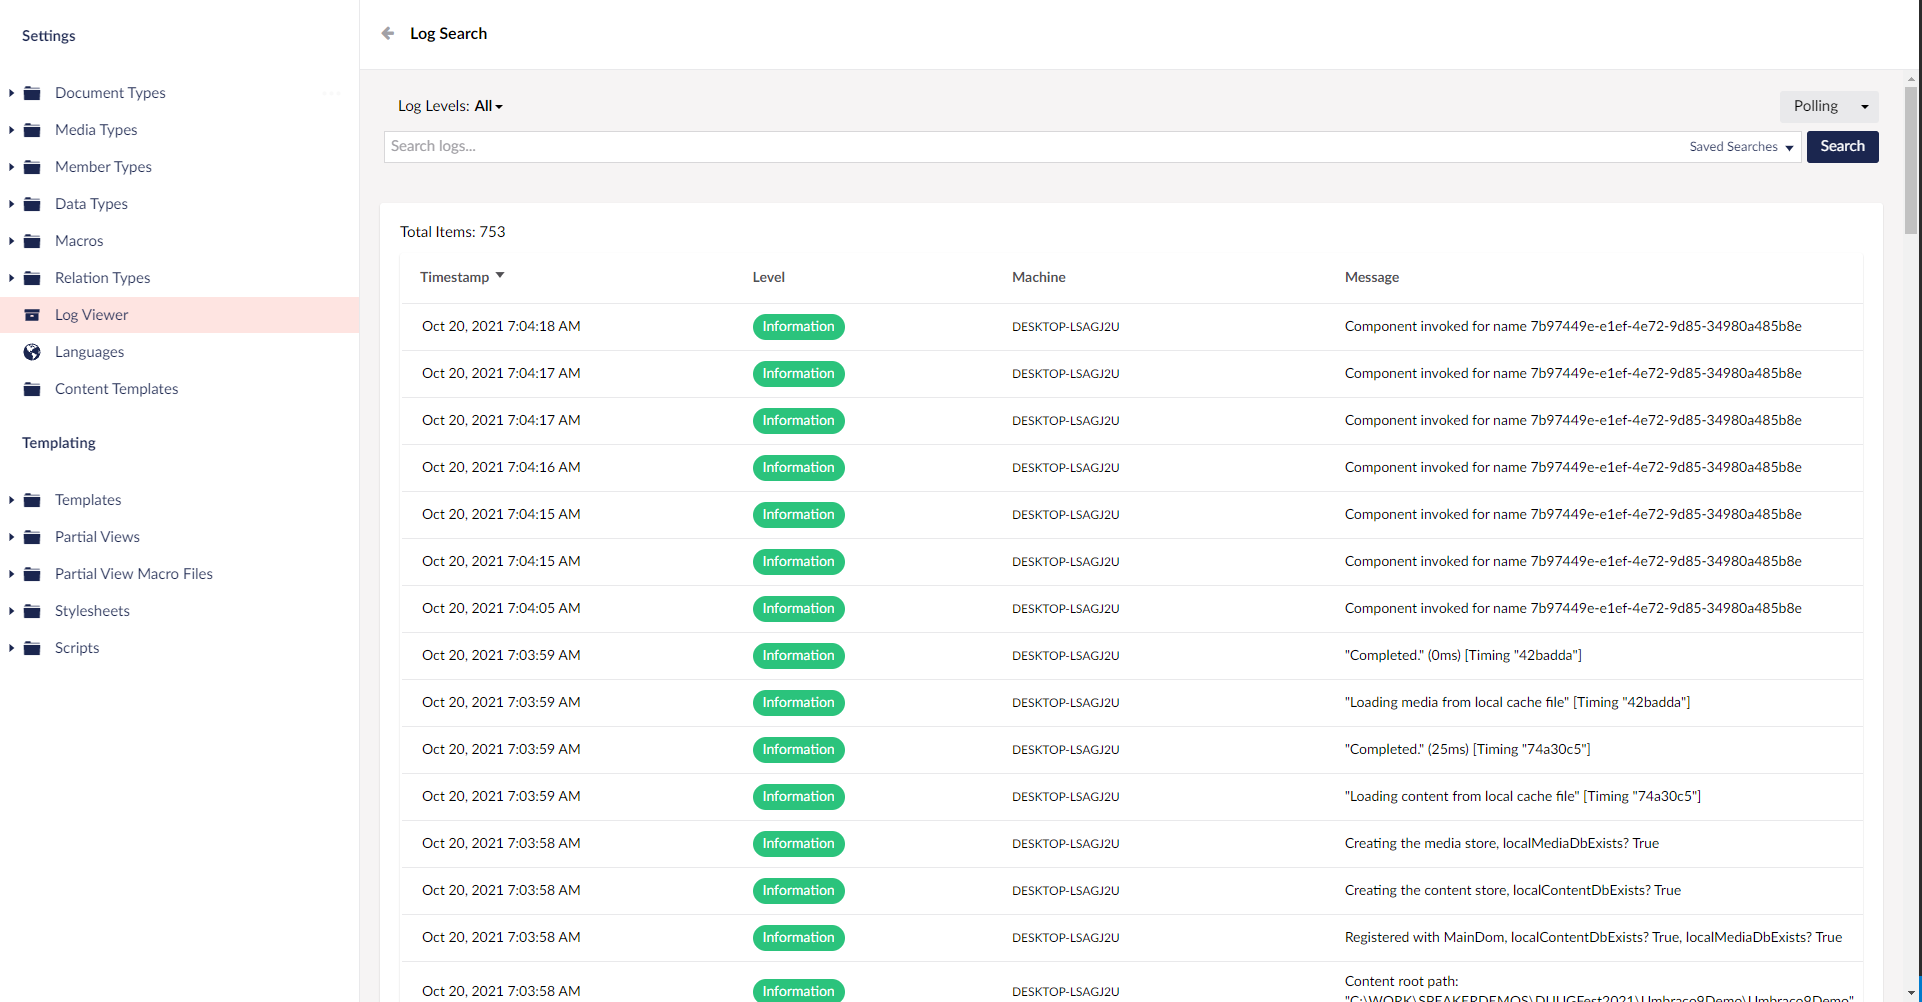
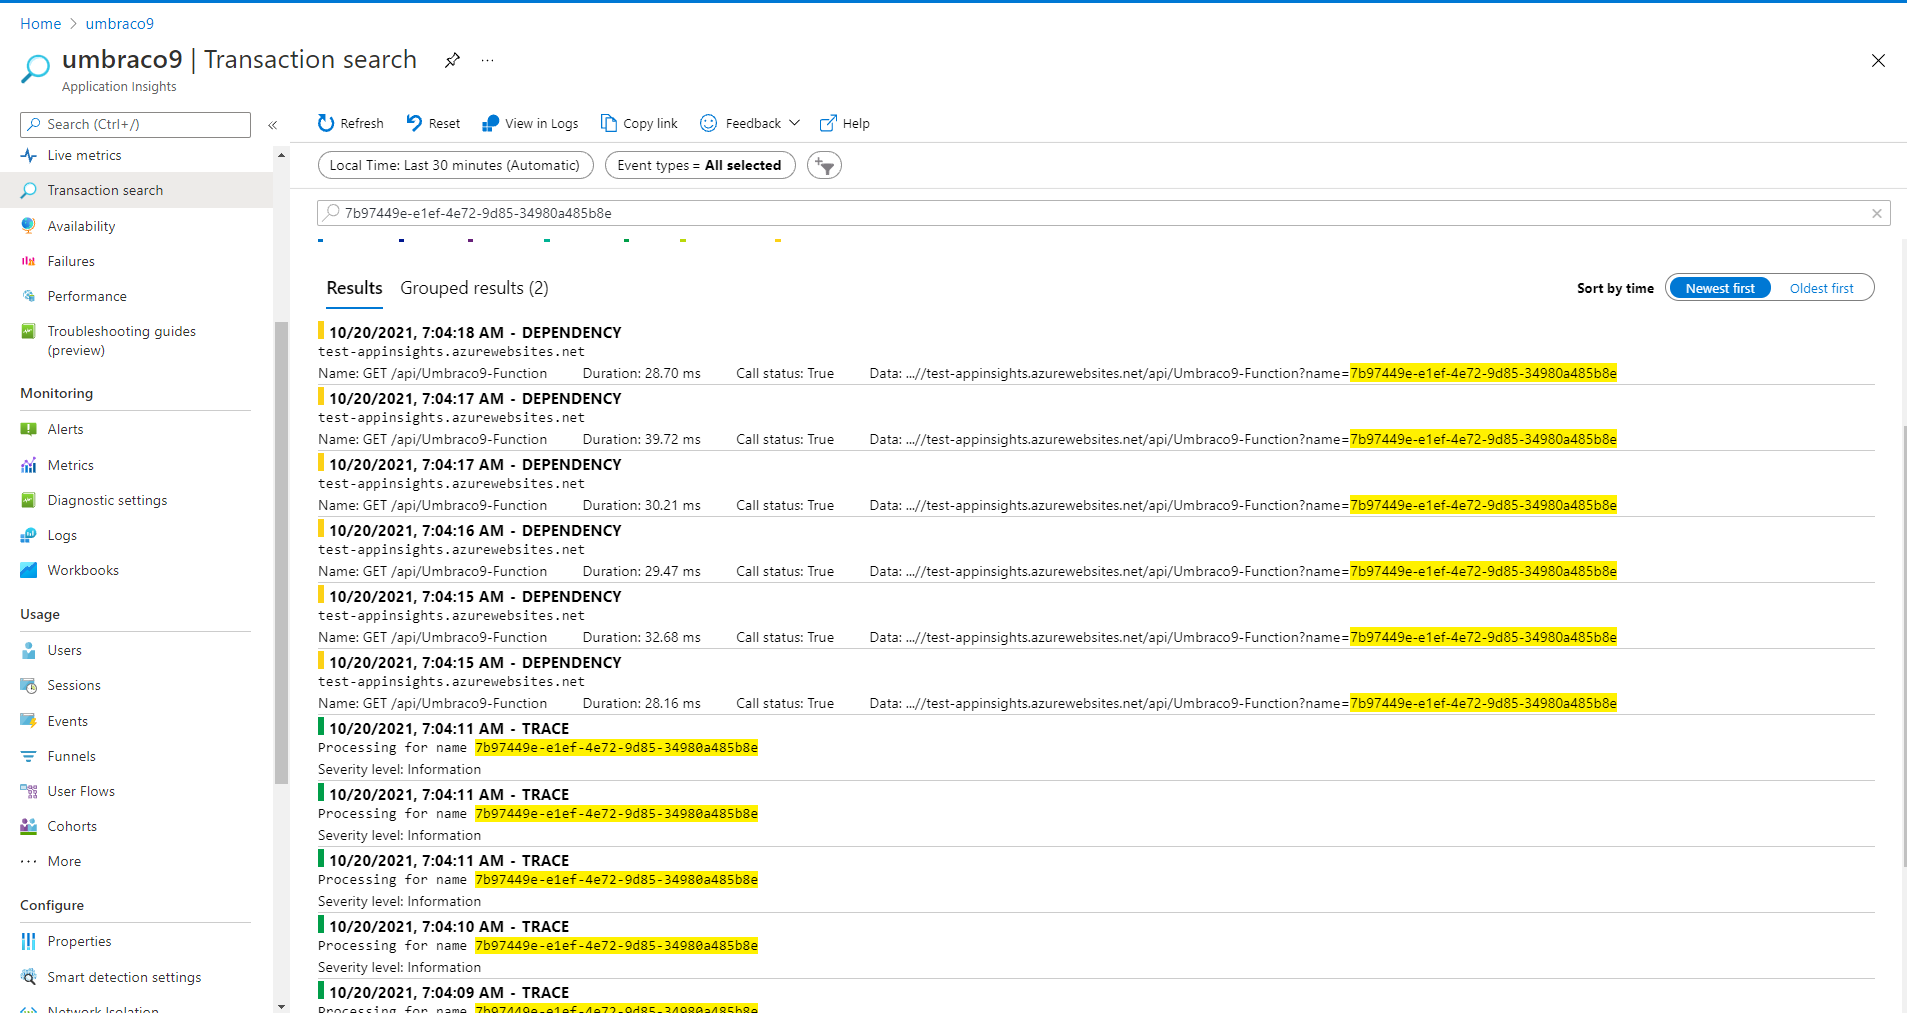
But my function logs to Application Insights and I have traceability of my value in Application Insights to analyse a particular request and investigate it should anything go wrong. I can search for the same value of my name querystring parameter in Transaction Search to understand what is going on.
This is a rather simple example but it can be very powerful if you have complex workflows and need end-to-end tracing of a transaction across distributed systems. Log as much details (take care about sensitive content) as you can to Application Insights.
I have covered only some of the features in Application Insights which I have used so far, primarily around investigating upon. There is a ton of features around acting upon the analysis from investigation with alerts and also understanding the usage of your website. Writing about all of that would be beyond the scope of a single article. But here are some of the other useful features
- Automatic warnings and alerts about potential performance problems and failures using Smart Detection. Machine Learning is used beneath the hood to understand and study the telemetry over the time to send alert notifications. This is all done by Application Insights which constantly analyses the telemetry it receives
- Availability Tests which can ping your website at regular intervals to ensure availability and send alerts. A classic simple test can be set up or there is a Standard test(in preview) that can ensure SSL certificate validity, check a url over various HTTP verbs(PUT, POST), check for the response, custom headers, etc.
- Load performance and page views reported by users
- Custom business events - events that you can author and track about
- Usage analysis - Similar to Google Analytics, collect telemetry by introducing a snippet of JavaScript code into your website which directs telemetry to Application Insights. It can analyze popular pages, number of users, user retention, etc. It can also correlate the requests into the backend so you see end-to-end telemetry. Exceptions from JavaScript code also then get captured alongside backend exceptions.
- Dashboards - Create custom dashboards aggregating the data from multiple resources
- Visual Studio Integration - Analyse telemetry from production environment and debug. Code Lens can highlight any exceptions from telemetry. This feature is available only in Visual Studio Professional & Enterprise editions
- All the telemetry data is stored in Log Analytics. You can run queries against the data using the Kusto Query Language
- REST API - You can make use of the REST API to query the telemetry data to create you own dashboards and applications.
That is it from me on Application Insights. I hope I have given you an overview of this Azure feature and how powerful this Azure feature can be. Happy troubleshooting!
A special note of thanks
A huge thanks to Phil Dye for reviewing my article. Your comments have been very valuable! #h5yr Phil!