
You've just shipped that new Umbraco 9 website into the wild. It looks magnificent, everything works as it should and you've got one happy client. Crack open the champagne, fire the party poppers, jump on Zoom with the client and have a virtual party! 🎉
But did you consider whether your page experience signals were up to scratch now that they are now a key ranking factor in your Google Search ranking?
Core Web Vitals, Lighthouse scores, PageSpeed Insights, page experience updates... what does it all mean?! 🤯
Sometimes it can be difficult to see the wood from the trees when considering how performant your website really is. Let's break down the different terms and tools you may have heard being thrown around recently:
Core Web Vitals
In simple terms, these are the three key areas (or "vitals") to concentrate on to ensure your site is fully optimised for a good quality user experience.
Since 2020, these focus on three aspects of the user experience:
- Loading Experience
- Prompt Interactivity
- Visual Stability
We'll go into further detail on these within the "Improving Performance" section below.
Google Lighthouse
Lighthouse is a useful tool from Google that provides a fast way of getting an instant report on how a page is performing based on Performance, Accessibility, Best Practise and SEO.
Available within Chrome or Microsoft Edge DevTools, from the command line, as a Node module, or via a handy online version, you simply pass a URL to be audited and it generates a report on how well the page did.
We'll go into detail on some of the possible outcomes of a Lighthouse report below, and how these can be addressed from within the context of an Umbraco website.
PageSpeed Insights
Similar to Lighthouse, this is a tool created by Google to provide two types of real-time data:
-
Lab data (providing in an instant test performed within a controlled environment using a predefined device and network settings)
-
Field data (provides recent real-world data on how it is experienced by real-life Chrome users, and provides additional context on unforeseen bottlenecks and how these can be improved)
Page Experience
A wider reaching set of signals that are combined to measure how users perceive the experience of interacting with your website. It includes Core Web Vitals as mentioned above, along with mobile-friendliness, HTTPS and intrusive interstitial guidelines (e.g. irresponsibly using annoying and intrusive popups that make content less accessible).
Where to start 🤔
The best place to start to obtain an initial audit of a few key pages is by using Lighthouse. The online version over on web.dev provides a quick and easy way to generate an initial audit.
Should you choose to run it via Chrome or Microsoft Edge DevTools, or via a Node module, take care to ensure that any anti-virus or firewall tools aren't interfering with the metrics! In particular, ensure that any form of HTTP protocol checking is temporarily disabled before running an audit.
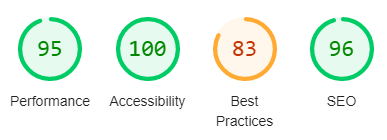
An example set of scores generated by a Lighthouse report
Once you have generated a Lighthouse report, there are four main areas to concentrate on improving your site:
- Performance
- Accessibility
- Best Practise
- SEO
The report will provide you with a score out of 100 in each of these areas. Should you be seeing four green circles (above 90) for each of these then a massive #h5yr as your site is already doing pretty well!
Though in all likelihood, there will be some areas for improvement, so let's dive into these four metrics and some of the common improvements that can be implemented for each...
Improving performance 🚀
Any Lighthouse or PageSpeed Insights report will outline the steps that can be taken towards improving website performance. Thinking about the Core Web Vitals again, these are the main drivers behind your site's overall Performance score:
Loading Experience - Largest Contentful Paint (LCP)
LCP is the time it takes for the main content of a page to be served in the browser and be ready to be interacted with.
That measurement is taken via the largest image or block of context that is visible to the user on initial page load and anything that extends beyond the screen does not count towards this metric. Most common elements factor into this are images, videos and block-level text elements such as headings and paragraph tags.
Prompt Interactivity - First Contentful Paint (FCP) or First Input Delay (FID)
The First Contentful Paint is when the browser renders the very first piece of content to the visible area of the screen, giving the first sign to the user that the page is actually loading. The time it takes to reach this is your FID metric
Visual Stability - Cumulative Layout Shift (CLS)
In simple terms, Cumulative Layout Shift refers to the unexpected shifting of elements while the page is still loading. Reducing CLS is important because pages that shift around unexpectedly can result a poor user experience. The sort of elements that tend to cause shift are:
- Fonts switching from the system font to one being loaded externally
- Images and videos without a predefined width and height (they don't take up any space until they're loaded!)
- Contact forms, buttons and other kinds of content
What can we do?
A good place to start improving LCP and FCP is to attempt to reduce the impact on render-blocking assets being loaded by the site. Most commonly these are fairly hefty CSS and JS assets that are most likely needed for the site to function.
A quick way to visualise the actual weight of the page is to click the "View Treemap" button just below the Performance metrics on a Lighthouse report.
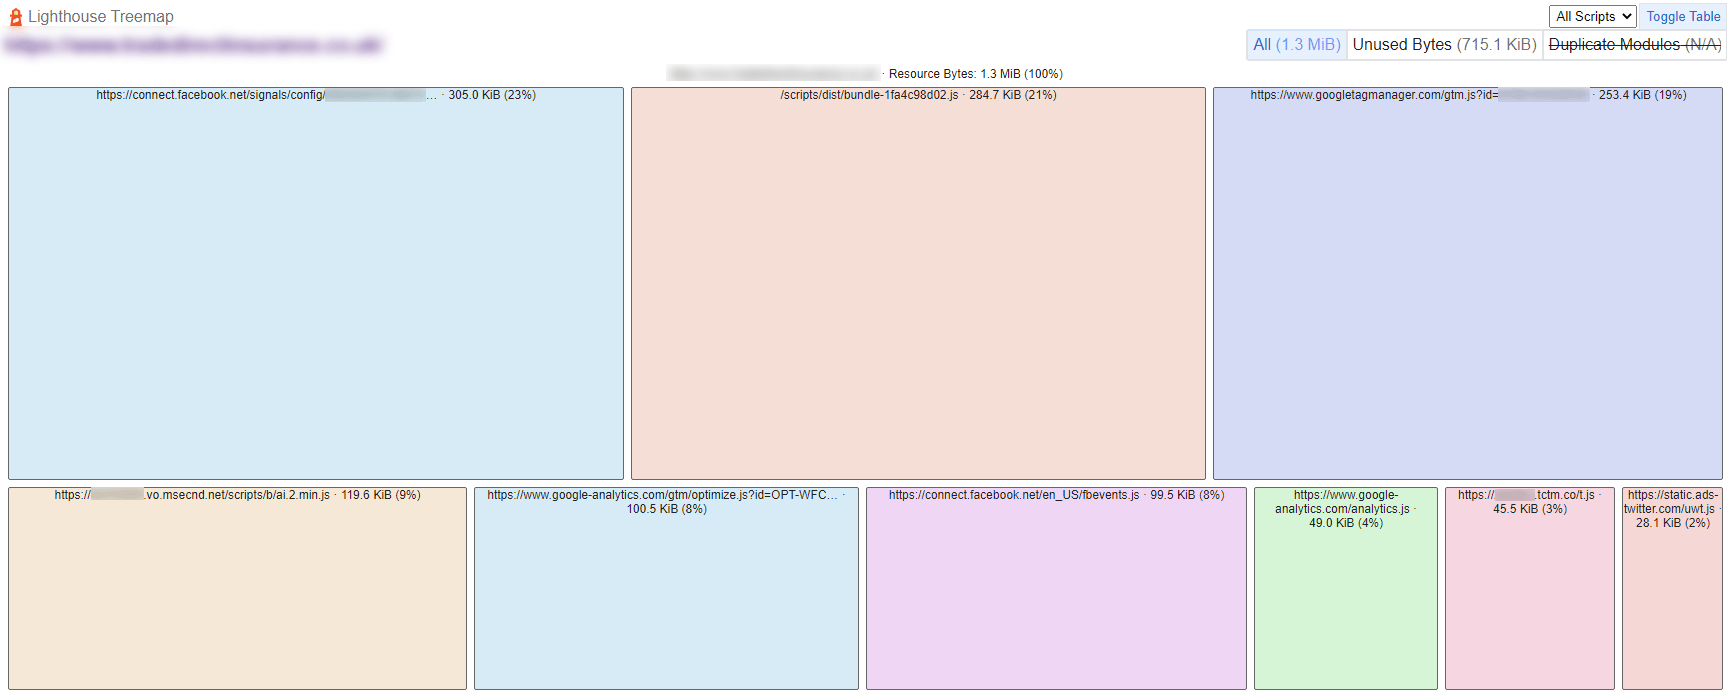
An example treemap showing the size and structure of page assets
This will usually help you to see what needs to be reduced. In the case of uncovering a heavy JavaScript bundle or other assets, there are tools such as Bundlephobia that assist with diagnosing which npm packages are causing bloat and could be removed or refactored.
Javascript optimisation
In a recent example, we discovered a site that was using the ubiquitous jQuery library, but could be replaced with vanilla JavaScript to maintain existing functionality.
This does of course cause a few headaches with Umbraco Forms, which relies heavily on jQuery for validation and multi-step functionality. However by utilising a small package such as PristineJS (<6kb minified) for validation and custom JS for conditional fields and multi-step functionality, it is possible to fully uncouple from jQuery and the even bigger jQuery Unobtrusive Validation!
Other commonly used jQuery dependant plugins such as jQuery UI, Fancybox (for modals) and Slick JS (for carousels) can be replaced with smaller vanilla JS versions.
CSS optimisation
CSS can usually be reduced by looking at repetitive classes or checking to make sure that there are no unnecessary @import rules in place. One common gotcha for those using SCSS/SASS is to avoid repetitive use of @extend rules, instead using "silent classes" to minimise repetitive declarations.
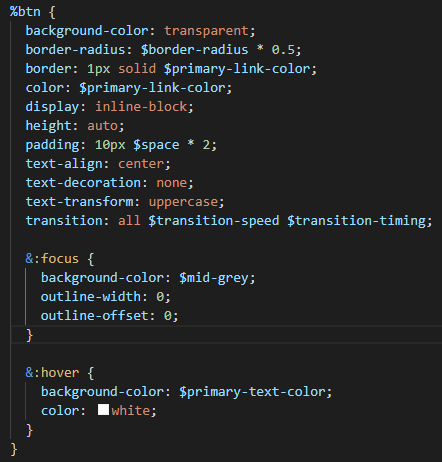
An example of using a SCSS silent class, in this case for buttons
Of course, the preferred way of optimising styles is to preload above-the-fold CSS, and then delay loading everything else. This can be a tricky technique to achieve, especially if the content being served above the fold on each page varies significantly.
It's possible to simply pull out any "default" CSS declarations relating to html, body, fonts, colours layout and header elements and into an inline style within the <head>, but that would cause issues with regards to maintainability.
Critical is well maintained npm package that allows extraction and inlining of critical-path CSS.
DNS preconnects
Implementing DNS preconnects using Umbraco's repeatable textstrings datatype allow the site to preload DNS for external resources from within the <head>. These resource hints allow your site to establish early connections to important third-party origins such as Google Fonts, Google Analytics, YouTube, Vimeo etc.
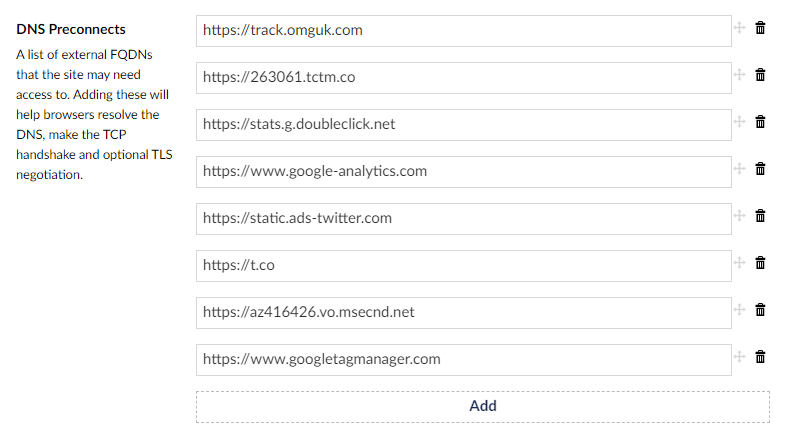
Using Umbraco's repeatable textstrings to populate external URLs
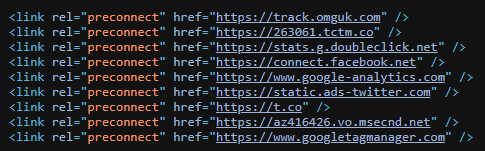
Rendered preconnects within the document head
Informing the browser of your intention to load these third-party assets help to make your site feel snappier to the user. After all, most of the time spent establishing a connection is spent waiting rather than exchanging data!
Inlining fonts & maintaining text visibility during webfont load
A common issue that you come across is third-party web fonts blocking rendering of the page. Just using the embed code provided by Google Fonts, Adobe Fonts or fonts.com is fine, however a Lighthouse report will most likely class the loader <script> as render blocking.
To get around this, it's a good idea to serve your fonts locally using @font-face declarations within your CSS. A useful tool for pulling down fonts locally from Google Fonts is google-fonts-helper. Simply select the required fonts and weights and the tool will generate your @font-face declarations and provide the font assets in the necessary formats.
Utilising a picture helper to serve WEBP formats
Unfortunately at the time of writing, Umbraco 9 doesn't play nicely with the latest version of ImageSharp. It's hoped that support will be fully restored for v10, but for the time being (and for non-production sites!) there is the alpha version of Slimsy 4, which claims support for Umbraco 9.2+.
Lazy loading images
Thankfully, native support for the loading attribute is now becoming more widely accepted, even on the latest version of Safari (just not for iframes!). There are other alternatives available; lazySizes is a tried and trusted vanilla JS solution that allows you to elegantly lazy load images.
Set explicit width & height on images to help alleviate CLS
As the name suggests, it's a good idea to have explicit width & height set on all images to stop any unwanted page shift (CLS) after they've fully loaded.
Using aspect ratio boxes can be a great way to "placehold" images before they're loaded
If that's difficult to achieve due to unknown dimensions (e.g. for content managed images), then the CSS aspect ratio box technique is a neat trick to implementing a "placeholder box" while the image is being loaded.
External forces that could be slowing you down
Finally, it's worth keeping an eye out for any external scripts and styles that could be adding to page loading speeds. Some good examples include Google Optimise, YouTube, Vimeo, cookie control mechanisms and many other scripts and stylesheets that could be loaded asynchronously or preloaded.
Those blank screenshots at the start of the timeline on your Lighthouse report could be caused by your client implementing an A/B testing script on the site without your prior knowledge!
Showing some love to accessibility, best practise & SEO ❤️
The primary objective of this article is to provide some useful advice on improving site performance around the Core Web Vitals, but that's all well and good if your site is not at it's best when it comes to accessibility, best practise and basic SEO.
Arguably, these are the simpler metrics to get in the green on your Lighthouse report, but there are some things that are often missed but easily fixed:
Accessibility
- Heading elements should be in a sequentially-descending order
- Buttons should contain descriptive names
- All images should have [alt] attributes (ideally with good descriptions!)
- Background and foreground colours have a sufficient contrast ratio
- Images have alt attributes (doing this with Umbraco media)
- Form elements have labels (checking Umbraco Forms partials)
Best Practise
- The site uses HTTPS and doesn't reference any non-HTTPS assets
- All npm packages, Umbraco and dependencies are up to date
- No browser errors are being logged to the console
- All images are displayed with the correct aspect ratio
SEO
- Meta title & description is present
- OpenGraph meta data is present
- A publicly accessible sitemap.xml is present
- A robots.txt file is in present and accessible
- Tap targets are appropriately sized and not overlapping (ALWAYS test on mobile!)
Wrapping up & future considerations 👀
In many cases, it's trying to squeeze out the last 20%-40% of performance improvement that takes most thought and prior planning to make those tougher gains. It may sound relatively simple in the explanation above, but that only comes through hours of research and implementation (which hopefully this article has saved some!).
Once you've finished putting all that effort into getting those Lighthouse/PageSpeed scores in the green, it's super important to put a few measures in place to ensure they don't slip back again, undoing all that hard work! Here are a few ideas on maintaining your Core Web Vitals in future:
- Integrate Lighthouse into your CI pipeline (there are some great extensions for Azure DevOps)
- Keep an eye out for new JS libraries/npm packages being imported by developers on your team. Have they been checked in Bundlephobia? Are they really necessary?
- Make content editors aware of best practises and image optimisation (and maybe even a quick lightning talk on how you took that underperforming site and turned it into a lightning fast thing to be proud of!)
References
- Web Vitals: https://web.dev/vitals/
- Measure page quality (powered by Lighthouse): https://web.dev/measure/
- PageSpeed Insights: https://pagespeed.web.dev/
- Understanding page experience in Google Search results: https://developers.google.com/search/docs/advanced/experience/page-experience
- Helping users easily access content on mobile: https://developers.google.com/search/blog/2016/08/helping-users-easily-access-content-on
- Bundlephobia: https://bundlephobia.com/
- Extract critical CSS: https://web.dev/extract-critical-css/
- Preconnect to required origins: https://web.dev/uses-rel-preconnect/
- google-webfonts-helper: https://google-webfonts-helper.herokuapp.com/fonts
- lazysizes: https://github.com/aFarkas/lazysizes